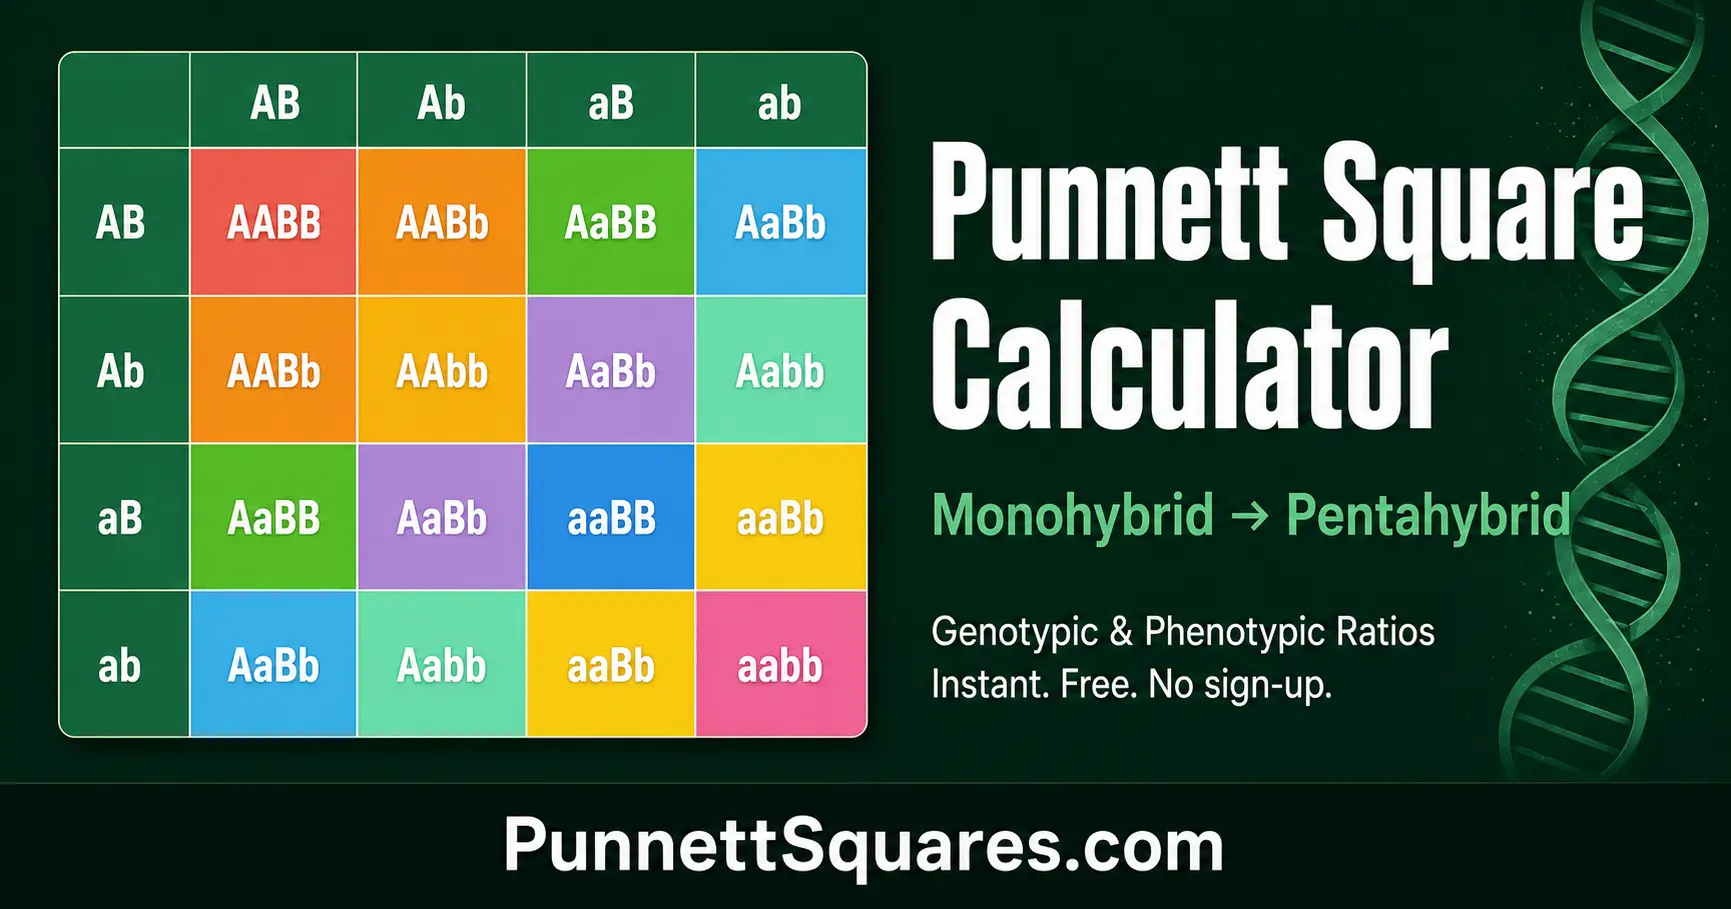
What Is a Punnett Square?
A Punnett Square is a grid-based diagram used in genetics to calculate the probability of each possible genotype and phenotype among offspring from a defined genetic cross. British geneticist Reginald Crundall Punnett introduced the method in 1905 while working on the inheritance of plumage colour in chickens at Cambridge University. He was collaborating with William Bateson, who had recently reintroduced Gregor Mendel's overlooked 1866 pea plant research to the scientific community.
Punnett's grid works by listing the possible gametes of each parent on the axes of a table. Each cell in the grid represents one possible zygote genotype — the product of one gamete from each parent combining at fertilisation. Because gametes are produced by meiosis, which follows Mendel's Law of Segregation, each parental allele pair separates and each gamete carries only one allele per locus. For crosses involving multiple genes on different chromosomes, the Law of Independent Assortment applies — alleles at different loci sort independently during meiosis, producing all possible gamete combinations with equal probability.
The cell count in the grid equals the total number of equally probable offspring genotype combinations. For a monohybrid cross, this is 4 (2 gamete types × 2 gamete types). For a dihybrid cross, 16 (4 × 4). For a pentahybrid cross involving five heterozygous genes, this reaches 1,024 (32 × 32). The proportion of each genotype among the cells directly gives the genotypic ratio; grouping by phenotype gives the phenotypic ratio.
How to Use This Punnett Square Calculator
- 1Choose a cross type: Select the number of gene loci to track — monohybrid (1 gene) through pentahybrid (5 genes). Each additional locus doubles the number of parental gametes and quadruples the grid size.
- 2Enter Parent 1 genotype: Type the first parent's genotype using letter pairs for each locus. Uppercase = dominant allele (A), lowercase = recessive allele (a). A heterozygous trihybrid parent is AaBbCc. A test cross partner is aabbcc. The calculator validates your input live.
- 3Enter Parent 2 genotype: Type the second parent's genotype in the same format. Any combination works — fully dominant (AABB), fully recessive (aabb), heterozygous (AaBb), or any mixed genotype.
- 4Read the colour-coded grid: Each unique genotype gets a distinct vivid colour. You can see at a glance which genotypes dominate the cross, which are rare, and which are impossible.
- 5Analyse genotypic and phenotypic ratios: Toggle between genotypic ratio (each unique allele combination) and phenotypic ratio (grouped by observable trait). The simplified ratio string (e.g. 9:3:3:1) appears above the ratio table.
- 6Download as PNG: Click Download PNG below the grid to save a high-quality image of your Punnett Square — useful for biology lab reports, teaching materials, and revision notes.
Mendelian Genetics — The Science Behind the Grid
Gregor Mendel's two fundamental laws govern every Punnett Square calculation. Mendel established these principles from his systematic experiments with Pisum sativum (garden peas) between 1856 and 1863, published in 1866 in his landmark paper Versuche über Pflanzenhybriden (Experiments on Plant Hybridization). He tracked seven distinct traits — seed colour, seed shape, pod colour, pod shape, flower position, stem length, and flower colour — each controlled by a single gene locus.
Law of Segregation
Each diploid organism carries two alleles for every gene locus. During the formation of gametes (via meiosis), these two alleles segregate so that each gamete receives exactly one. At fertilisation, the two parental alleles reunite in the zygote. This is why every cell in a Punnett Square contains exactly two alleles — one from each parent's gamete.
Law of Independent Assortment
For genes located on different chromosomes (unlinked loci), the alleles of one gene segregate independently of the alleles of another gene during meiosis. This produces all possible gamete combinations with equal frequency — four gamete types for a dihybrid (AB, Ab, aB, ab), eight for a trihybrid, and so on. Linked genes on the same chromosome violate this law and require recombination frequency analysis, not standard Punnett Squares.
These laws apply under complete dominance. Several non-Mendelian inheritance patterns modify the phenotypic outcomes while keeping the underlying allele segregation identical. In incomplete dominance, heterozygotes show an intermediate blended phenotype. In codominance, both alleles are fully expressed simultaneously. Epistasis, penetrance, and expressivity are additional layers of complexity beyond the single-gene Mendelian model.
Types of Genetic Crosses — Monohybrid to Pentahybrid
The term "hybrid" in a cross refers to the number of gene loci tracked, not the number of generations. The grid size and number of gamete types scale exponentially: each additional heterozygous locus doubles the gamete diversity per parent and multiplies the offspring combinations by four.
| Cross Type | Genes Tracked | Grid Size | Total Cells | Gametes / Parent | Phenotypic Ratio* |
|---|---|---|---|---|---|
| Monohybrid | 1 | 2×2 | 4 | 2 | 3:1 |
| Dihybrid | 2 | 4×4 | 16 | 4 | 9:3:3:1 |
| Trihybrid | 3 | 8×8 | 64 | 8 | 27:9:9:9:3:3:3:1 |
| Tetrahybrid | 4 | 16×16 | 256 | 16 | 81:27:27:... (81 combinations) |
| Pentahybrid | 5 | 32×32 | 1,024 | 32 | 243:... (243 dominant combinations) |
* Phenotypic ratios assume complete dominance and independent assortment throughout. Both parents are fully heterozygous at all loci (e.g. AaBb, AaBbCc).
Genotypic Ratio vs Phenotypic Ratio — Key Differences
A genotypic ratio counts every distinct allele combination. For Aa × Aa, this is 1 AA : 2 Aa : 1 aa — three distinct genotypes in a 1:2:1 ratio. A phenotypic ratio groups genotypes by observable trait. Since AA and Aa both show the dominant phenotype under complete dominance, the 1:2:1 genotypic ratio collapses to a 3:1 phenotypic ratio.
The distinction matters enormously in genetics. Two carriers (Aa × Aa) have a 75% chance of dominant-phenotype offspring — but only 1 in 3 of those dominant-phenotype offspring (33.3%) is actually homozygous dominant (AA). The other two-thirds are carriers (Aa) who can still pass the recessive allele to their own offspring. This is directly relevant to autosomal recessive disease risk calculations in medical genetics.
Genotypic ratio: 1 AA : 2 Aa : 1 aa
Three distinct genotypes. Each cell in the Punnett Square corresponds to one combination of parental gametes. The 1:2:1 ratio is universal for any Aa × Aa monohybrid cross. It becomes more complex for dihybrid and higher crosses.
Phenotypic ratio: 3 dominant : 1 recessive
Two observable phenotype classes. AA and Aa look identical under complete dominance, so they are grouped together. Only aa shows the recessive phenotype. The 3:1 ratio holds for monohybrid crosses between two heterozygotes — confirmed by Mendel's pea plant data.
Dominant and Recessive Alleles — Molecular Basis
Dominance is a phenotypic relationship between alleles at the same locus — it describes which allele's product is expressed when two different alleles are present. At the molecular level, dominant alleles typically encode a functional protein product that produces the dominant phenotype even when only one copy is present. Recessive alleles often encode a non-functional or absent protein — the phenotype only appears when both copies are non-functional.
In Mendel's pea plants, the round seed allele (R) is dominant because it encodes a functional starch-branching enzyme (SBEI). The wrinkled allele (r) contains a transposon insertion that disrupts the SBEI gene, producing a non-functional enzyme. Heterozygous Rr plants produce enough functional SBEI from the single R allele to produce round seeds — hence R is dominant over r.
Dominant allele (A)
Written as an uppercase letter. Expresses its phenotype in both AA and Aa genotypes. One functional copy is sufficient. Examples: round seeds (R), yellow seeds (Y), tall plants (T) in Mendel's experiments.
Recessive allele (a)
Written as a lowercase letter. Only expresses its phenotype in the aa genotype. Heterozygotes (Aa) are carriers — they carry the allele without expressing it. Examples: wrinkled seeds (r), green seeds (y), dwarf plants (t) in peas.
Incomplete dominance and codominance are exceptions to this binary model. See our Incomplete Dominance Calculator and Codominance Calculator for these cases. For an authoritative molecular perspective, the NCBI Genetics Primer covers allele interactions in depth.
Punnett Square Worked Examples
Monohybrid cross: Aa × Aa
Purple-flowered heterozygous pea plants crossed with each other. Purple (A) is dominant over white (a). This is the F1 × F1 cross that produced Mendel's famous 3:1 ratio across thousands of plants.
Dihybrid cross: AaBb × AaBb
Two genes on separate chromosomes — seed colour (A/a) and seed shape (B/b). Both parents are double heterozygotes. This cross confirms independent assortment and produces the 9:3:3:1 ratio Mendel verified across 556 seeds.
9 A_B_ : 3 A_bb : 3 aaB_ : 1 aabb
The 9:3:3:1 ratio only holds when both genes are unlinked (on different chromosomes), both show complete dominance, and both parents are heterozygous at both loci. Linked genes produce different ratios dependent on recombination frequency.
Test cross: Aa × aa
A test cross crosses a dominant-phenotype individual with a homozygous recessive tester. If offspring are all dominant phenotype, the test subject is homozygous dominant (AA). A 1:1 ratio of dominant to recessive offspring confirms the subject is heterozygous (Aa).
50% Aa (dominant phenotype) : 50% aa (recessive phenotype)
Backcross vs test cross
A test cross uses a homozygous recessive individual (aa) as the tester. A backcross crosses a hybrid offspring with either parent. In Mendel's experiments, F1 hybrids (Aa) crossed back to the recessive parent (aa) confirmed heterozygosity. Backcrosses to the dominant parent (AA) always produce dominant phenotype offspring and cannot distinguish AA from Aa parents.
When Punnett Squares Don't Apply — Limitations and Exceptions
Punnett Squares assume a simplified model of inheritance. Several biological realities limit their accuracy in real populations:
Gene linkage
Genes on the same chromosome do not assort independently. Linked loci violate the Law of Independent Assortment. Recombination (crossing over) partially shuffles linked alleles during meiosis, at a frequency proportional to the physical distance between loci on the chromosome.
Incomplete dominance and codominance
In incomplete dominance, heterozygotes show a blended intermediate phenotype (e.g. pink flowers from red × white). In codominance, both alleles are simultaneously expressed (e.g. blood type AB). Both change the phenotypic ratio without altering the genotypic ratio.
Polygenic inheritance
Traits like human height, skin colour, and intelligence are governed by many genes simultaneously. No single Punnett Square can model these. Eye and hair colour involve at least 16 and 12 genes respectively, requiring population genetics models rather than simple Mendelian ratios.
Epistasis
Epistasis occurs when one gene locus masks the expression of another. For example, in Labrador Retriever coat colour, the E locus controls whether any pigment is deposited, masking the B locus (yellow versus black versus chocolate). This produces modified phenotypic ratios that deviate from standard 9:3:3:1.
Small sample sizes
Punnett Square ratios are theoretical probabilities, not guarantees. A couple with a 25% chance of an affected child may have four unaffected children — or four affected children. The 3:1 or 9:3:3:1 ratio emerges as an average across many offspring, not as a prediction for any specific family.
Sex-linked inheritance
Genes on the X or Y chromosomes follow different inheritance patterns. X-linked recessive traits (haemophilia A, red-green colour blindness, Duchenne muscular dystrophy) appear predominantly in males because they have only one X chromosome. Standard Punnett Squares must be modified to show sex chromosomes.
Frequently Asked Questions — Punnett Square Calculator
What is a Punnett Square and who invented it?
What is a monohybrid cross?
What is a dihybrid cross and what ratio does it produce?
What is a genotypic ratio?
What is a phenotypic ratio?
What is the difference between homozygous dominant, heterozygous, and homozygous recessive?
What is the difference between dominant and recessive alleles?
Does this Punnett Square calculator work for trihybrid and higher crosses?
Related Tools
Incomplete Dominance Calculator
Model crosses where heterozygotes show a blended intermediate phenotype — red × white producing pink offspring.
Open CalculatorCodominance Calculator
Solve crosses where both alleles are fully expressed simultaneously — ABO blood type, roan cattle, MN blood group.
Open CalculatorBaby Genetics Calculator
Estimate offspring eye colour, hair colour, and blood type probabilities from both parents' traits.
Open CalculatorBlood Type Calculator
Calculate offspring ABO and Rh blood type probabilities. Includes transfusion compatibility reference.
Open CalculatorHardy-Weinberg Calculator
Calculate allele and genotype frequencies under Hardy-Weinberg equilibrium. Test populations for evolutionary forces.
Open CalculatorEye Color Predictor
Estimate offspring eye colour probabilities based on HERC2/OCA2 gene research and parental phenotypes.
Open Calculator