Oligo Analyzer for PCR Primer & Probe Design
Evaluate oligonucleotides against the SantaLucia nearest-neighbor model. Get melting temperature, hairpin secondary structure, self-dimer alignments, ΔG, molecular weight, and extinction coefficient in a single live report.
Analyse an oligonucleotide
Paste a DNA sequence to score it against the standard PCR design window: 18–24 nt, 40–60% GC, Tm 55–65 °C, no stable hairpins, no self-dimers at the 3′ end.
Oligonucleotide sequence
Conditions
- ⚠ Self-dimer: 6 contiguous pair matches detected.
Melting temperature comparison
Design parameter ranges
Hairpin prediction
Self-dimer prediction
Complementary strands
TGGTGTCAGGTACGGTAGTGGTGATGGCATGGACTGTGGT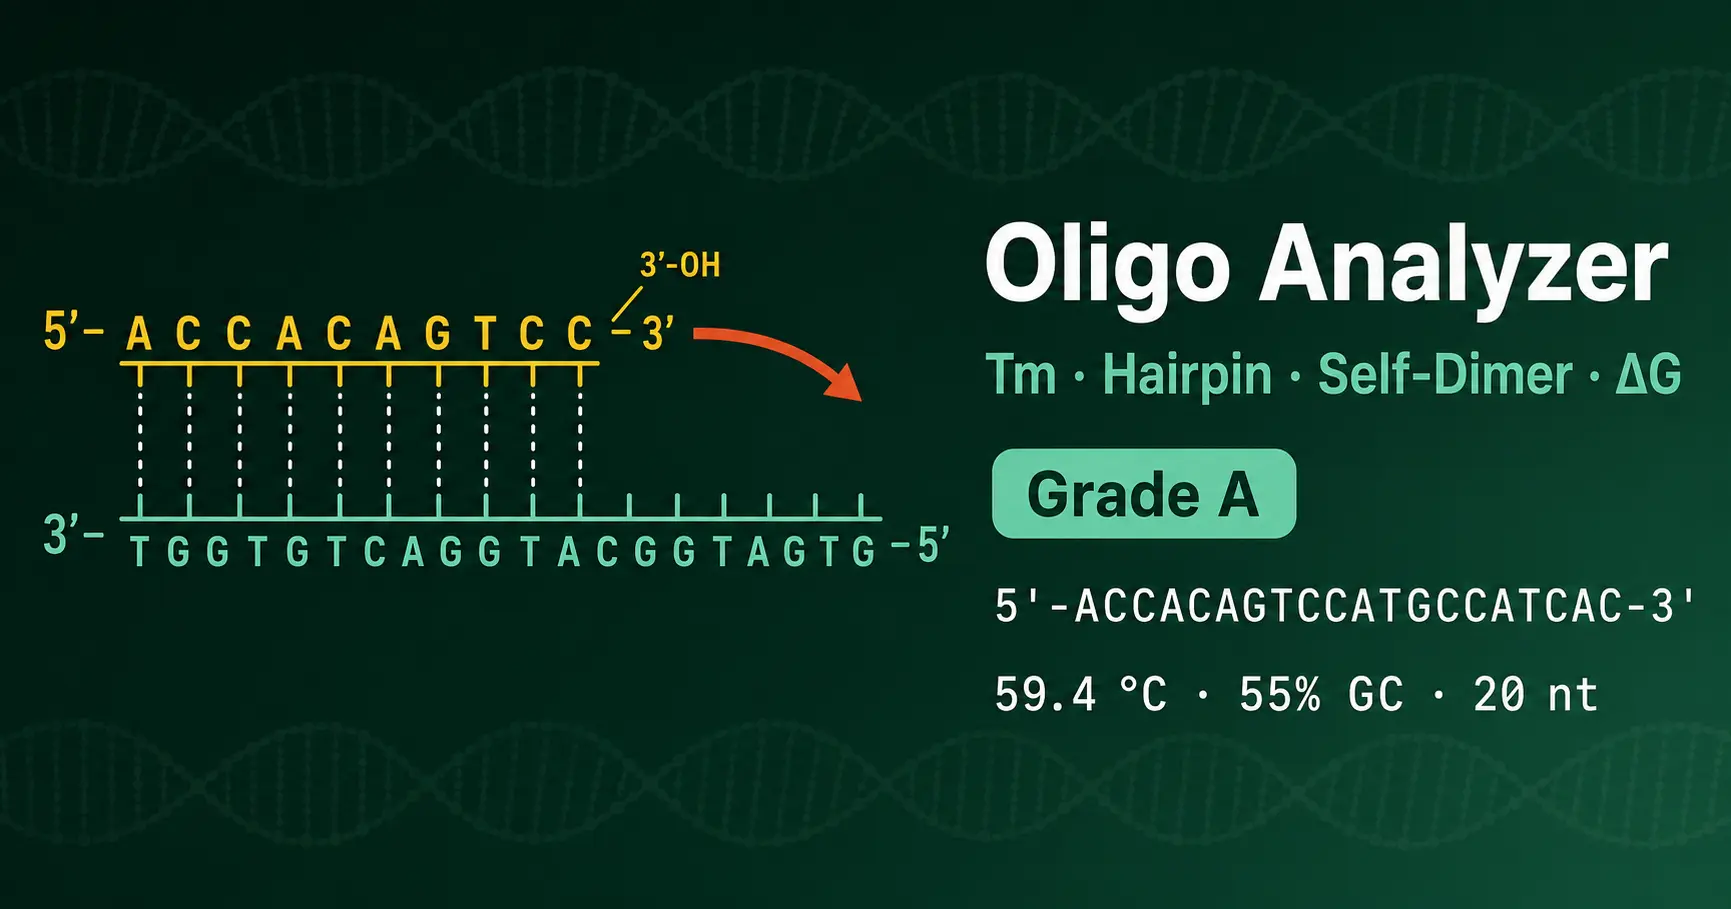
What an oligo analyzer measures
Every PCR primer, qPCR probe, and sequencing oligonucleotide carries a set of physical properties that determine whether it works. Length controls specificity. GC content controls thermal stability. Melting temperature determines the working annealing temperature. Hairpins and self-dimers compete with productive binding to the template. An oligo analyzer pulls these properties out of the sequence and presents them as a design report.
The thermodynamic backbone of modern analyzers comes from John SantaLucia's 1998 unified nearest-neighbor parameters, published in PNAS. SantaLucia averaged data from seven independent laboratories to produce a single internally consistent set of ΔH and ΔS values for the 10 unique Watson–Crick dimers (AA/TT, AT, TA, CA/TG, GT/AC, CT/AG, GA/TC, CG, GC, GG/CC). Those numbers underpin essentially every commercial primer-design tool sold today.
A non-obvious fact: the nearest-neighbor energy of GC is more negative than CG, even though both dimers contain one G and one C. This stacking asymmetry means two sequences with identical base composition can have Tm values differing by 4–6 °C. Composition-only formulas (Wallace, Marmur–Schildkraut) miss this entirely.
The nearest-neighbor model
The nearest-neighbor equation calculates Tm by summing dimer contributions plus terminal and initiation corrections:
The terminal AT correction adds +2.2 kcal/mol to ΔH and +6.9 cal/(K·mol) to ΔS per terminal A·T pair, because terminal A·T pairs fray more readily than terminal G·C pairs. The salt correction (Owczarzy 2004) adjusts Tm for working sodium and magnesium concentrations using a logarithmic dependence on monovalent cation activity.
Free energy at body temperature (ΔG37 = ΔH − 310.15 · ΔS / 1000) predicts duplex stability under physiological conditions. ΔG values more negative than −9 kcal/mol indicate stable annealing; values less negative than −5 kcal/mol predict unstable binding even at low temperatures.
Worked examples
Example 1: Well-designed qPCR primer
Sequence: 5′-ACCACAGTCCATGCCATCAC-3′ (20 nt, GAPDH forward)
Length 20 nt (optimal), GC = 55% (optimal), nearest-neighbor Tm at 250 nM / 50 mM Na+ ≈ 59.4 °C. The 3′ end CAC contains one C providing modest GC clamp. No stable hairpin or self-dimer at the 3′ end.
Verdict: Grade A. Pair with a reverse primer of similar Tm and amplify at 58–60 °C annealing.
Example 2: Problem oligo with hairpin
Sequence: 5′-GCGGCGGCCGCGGCCGCGGGCCG-3′ (23 nt)
GC = 91% (far above target), nearest-neighbor Tm exceeds 78 °C, and the analyzer detects multiple inverted repeats producing a 6-bp stem with a 3-nt loop. ΔG of the hairpin is below −5 kcal/mol — stable at PCR annealing temperatures.
Verdict: Grade D. Redesign with a different target region; this sequence will form intramolecular structure faster than it will anneal to template.
Hairpins and self-dimers in detail
Hairpins arise from intramolecular base pairing. The analyzer searches for inverted repeats — sequences where a region of the oligo matches the reverse complement of another region within the same strand. When the two regions can fold back with a loop of at least three nucleotides between them, a stem-loop structure can form. Stems of three or four base pairs are usually marginal; five or more, especially GC-rich, persist at PCR annealing temperatures and reduce yield.
Self-dimers are intermolecular. Two copies of the same oligonucleotide can anneal in an antiparallel orientation if they share a stretch of self-complementary sequence. The analyzer slides the oligo against its reverse complement at every possible offset and reports the alignment with the most contiguous matches. Self-dimers at the 3′ end are particularly damaging because they create a self-priming substrate that the polymerase can extend, generating short artefact products that consume primer and nucleotide pools.
The biological consequence shows up in real experiments. Primer-dimers compete kinetically with template binding, dominate amplification in low-template wells, produce ghost bands on agarose gels, and inflate the SYBR signal in qPCR no-template controls. For probe-based qPCR, dimers are less harmful because the fluorogenic probe ignores them, but they still consume primer and reduce sensitivity.
Practical applications
Standard PCR primer design. Target 18–24 nt with 40–60% GC, Tm 55–65 °C, and a single G or C in the 3′ pentamer. Forward and reverse primers should have Tm within 5 °C of each other to allow a single annealing temperature.
qPCR probe design. TaqMan probes typically run 18–30 nt with Tm 8–10 °C higher than the flanking primers, so the probe binds first during the annealing step. Avoid runs of identical nucleotides, especially G, which can quench fluorescence.
Sequencing primers. Sanger sequencing primers tolerate a wider design window (17–25 nt, Tm 50–65 °C) because the BigDye terminator chemistry runs at one annealing temperature regardless of primer choice. The 3′ end matters more than internal structure since polymerase incorporation depends on a free 3′-OH.
Allele-specific PCR. Place the polymorphic position at the 3′ end. Mismatches at the terminal nucleotide block extension by Taq polymerase, providing single-base discrimination. The analyzer's hairpin and dimer check is critical because the constrained 3′-end design often produces problematic structures.
Limitations and caveats
The nearest-neighbor parameters assume standard Watson–Crick base pairing in dilute aqueous solution. They do not capture the effects of GC-rich secondary structure in the template, magnesium concentration above 5 mM, formamide or DMSO co-solvents, or template tertiary structure. For GC-rich amplicons over 70% GC, use enzymes specifically validated for those conditions (KAPA HiFi GC, Phusion GC buffer).
The hairpin detector here uses a simple inverted-repeat search rather than a full dynamic-programming fold algorithm. For exhaustive secondary structure prediction with ΔG values, use Mfold or UNAFold. Similarly, the self-dimer detector finds the best contiguous alignment but does not score gapped alignments — short gapped pairings can still cause primer-dimer issues.
This analyzer is built for teaching and primer screening. For clinical diagnostic assay design or any application under regulatory oversight, validate with at least one nearest-neighbor tool with documented parameter provenance (such as IDT OligoAnalyzer) and confirm empirically with melt-curve analysis.
Frequently asked questions
What does an oligo analyzer calculate?
Which Tm calculation method is most accurate?
What is a primer hairpin and why does it matter?
What is a primer-dimer and how does the analyzer detect it?
What is the ideal length and GC content for a PCR primer?
How do salt and primer concentration affect Tm?
What is the extinction coefficient and why do I need it?
Can I use this analyzer for modified oligonucleotides?
Educational note. This analyzer is built for teaching, coursework, and primer screening. For clinical or regulated-assay primer design, validate with calibrated commercial tools and empirical melt-curve confirmation. References: SantaLucia 1998, PNAS, NCBI.
Related Tools
GC Content Calculator
Measure G+C percentage, base composition, and Tm for DNA or RNA sequences.
Open CalculatorOligo Dilution Calculator
Compute volumes for diluting stock oligos to working concentration.
Open CalculatorOligo Resuspension Calculator
Find the water volume to resuspend lyophilised oligos at target concentration.
Open CalculatorOligo Concentration Calculator
Convert OD₂₆₀ absorbance to oligonucleotide concentration using ε₂₆₀.
Open Calculator