Preset buttons
These buttons load common classroom scenarios. They include tight linkage, a 50 cM unlinked control, coupling phase, repulsion phase, and linked intercross examples.
Calculate linked-gene gamete probabilities, recombinant classes, and expected offspring ratios from recombination frequency. Use this tool for AB/ab coupling phase, Ab/aB repulsion phase, test crosses, and linked dihybrid intercrosses.
Adjust recombination frequency, phase, cross type, and offspring number. The linked gamete and offspring probabilities update instantly.
Load a common linkage example, then adjust phase, recombination frequency, cross type, and sample size.
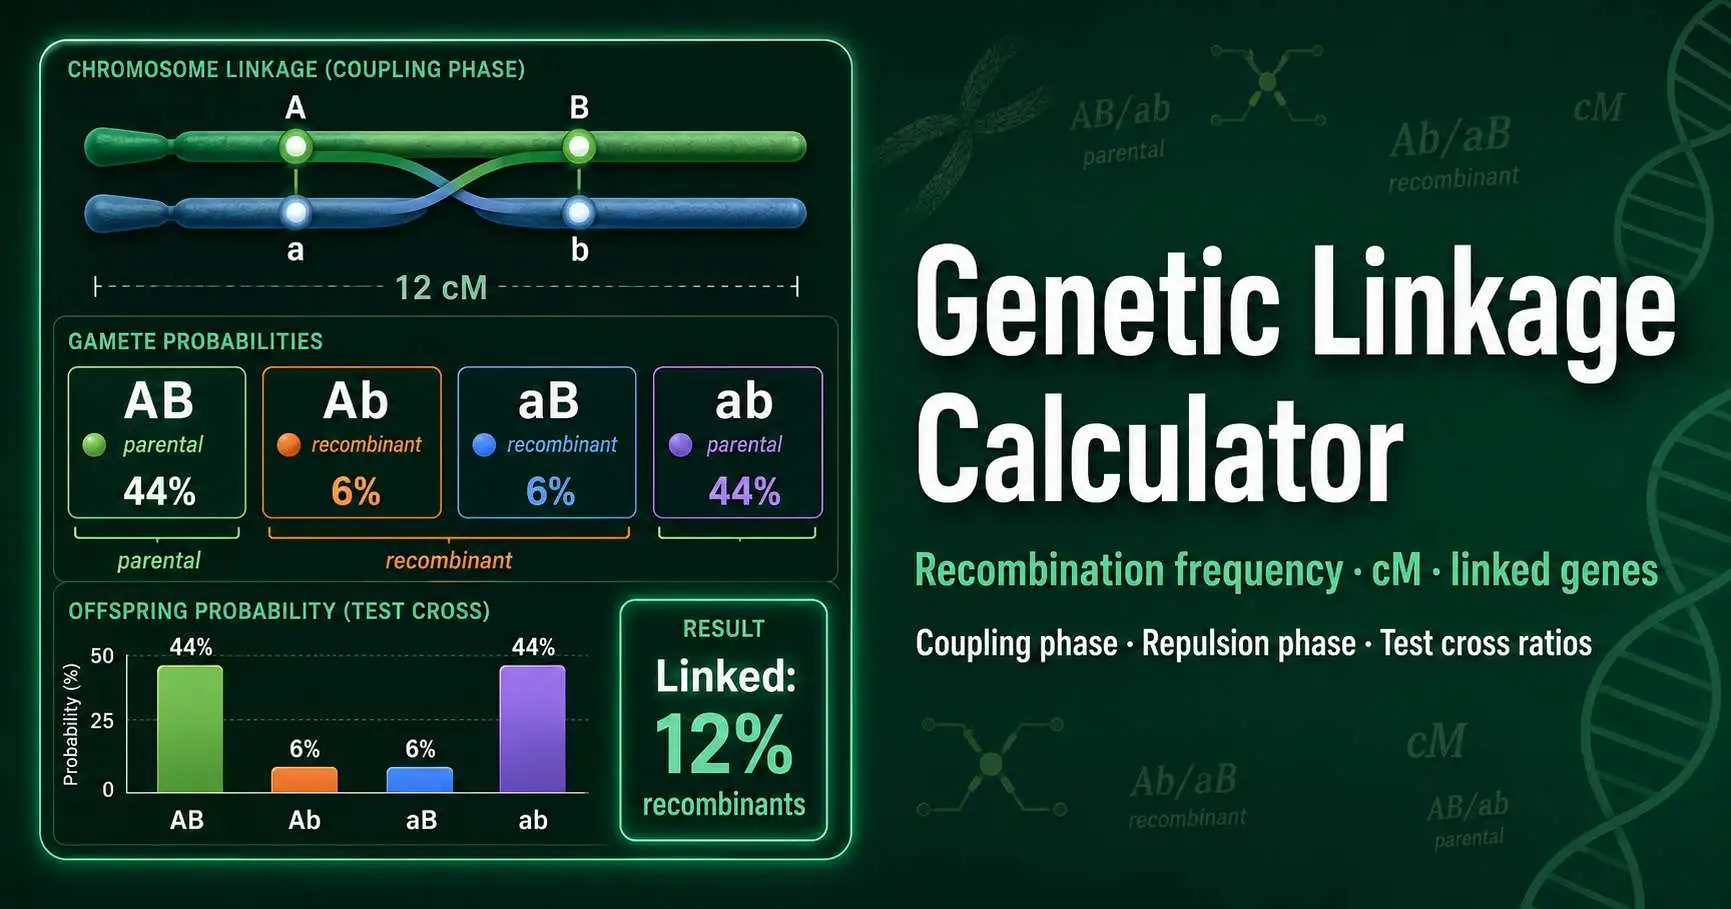
AB/ab × aabb with 12% recombination. Parental classes dominate the offspring.
Choose whether the dominant alleles sit on the same homolog or opposite homologs.
Choose a double-recessive tester or a second linked heterozygote.
tester
Live linkage result
The genes sit close enough that parental gametes strongly outnumber recombinant gametes.
Distance
12.0 cM
Recombinants
12.0%
Top phenotype
44.0%
Parental gametes preserve the original chromosome arrangement. Recombinant gametes require a crossover between A and B.
These probabilities combine the gametes from both parents and convert genotypes into phenotype classes.
Linked intercrosses can produce several genotype classes. The table ranks them from most likely to least likely.
| Genotype | Probability | Expected count | Relative bar |
|---|---|---|---|
| aabb | 44.00% | 220 | |
| AaBb | 44.00% | 220 | |
| aaBb | 6.00% | 30 | |
| Aabb | 6.00% | 30 |
Genetic linkage describes genes that sit on the same chromosome and travel together through meiosis more often than independent assortment predicts. Thomas Hunt Morgan linked chromosome inheritance with visible fruit fly traits in the early twentieth century. Alfred Sturtevant then used recombination frequencies to build the first genetic map in 1913.
Crossing over breaks linkage when homologous chromatids exchange DNA between two loci. A short interval produces fewer crossovers, so parental allele combinations remain common. A longer interval produces more recombinant chromatids, but the observable recombination frequency reaches a 50% ceiling.
OpenStax explains that Sturtevant used map units, now called centimorgans, where 0.01 recombination frequency corresponds to 1 cM. Read the OpenStax linkage chapter.
Choose AB/ab for coupling phase or Ab/aB for repulsion phase in the linked heterozygous parent.
Type the map distance in centimorgans from 0 to 50. The calculator treats 1 cM as about 1% recombination for short intervals.
Use aabb for a mapping test cross, or use another linked heterozygote for an intercross-style probability model.
Compare parental gametes, recombinant gametes, phenotype probabilities, and expected offspring counts.
These buttons load common classroom scenarios. They include tight linkage, a 50 cM unlinked control, coupling phase, repulsion phase, and linked intercross examples.
This card sets the chromosome arrangement in the heterozygous parent. AB/ab makes AB and ab parental gametes, while Ab/aB makes Ab and aB parental gametes.
The slider represents map distance from 0 to 50 cM. Lower values increase parental classes, while 50 cM produces the independent assortment limit.
The aabb tester makes offspring phenotypes reveal parent 1 gametes directly. The linked heterozygote option models a linked dihybrid-style cross.
The banner summarises linkage strength, map distance, recombinant percentage, and the most common phenotype class for the current settings.
The bars and genotype table show exact probabilities and expected offspring counts. They help you compare parental classes with recombinant classes without manual Punnett square arithmetic.
Phase decides which allele combinations count as parental. In coupling phase, a heterozygote carries AB on one homolog and ab on the other. In repulsion phase, it carries Ab on one homolog and aB on the other.
A 12 cM coupling-phase test cross gives AB and ab gametes at 44% each. Ab and aB recombinants appear at 6% each. The total recombinant fraction equals 12%, which matches the map distance for a short interval.
This logic also explains why linked genes can disrupt a dihybrid 9:3:3:1 ratio. Independent assortment requires four equal gamete classes from an AaBb parent. Linkage makes the two parental gametes more common than the two recombinant gametes.
The linked heterozygote makes AB and ab parental gametes at 45% each. It makes Ab and aB recombinant gametes at 5% each. A double-recessive tester contributes only ab gametes.
Among 1,000 offspring, the expected counts equal 450 A_B_, 50 A_bb, 50 aaB_, and 450 aabb. The two rare classes identify the crossover products.
Repulsion phase changes the parental classes. Ab and aB gametes each appear at 40%, while AB and ab recombinants each appear at 10%. The map distance still equals 20 cM.
In 500 offspring, you expect 50 A_B_, 200 A_bb, 200 aaB_, and 50 aabb. The dominant-dominant and double-recessive classes now represent recombination.
Linkage mapping helps geneticists locate genes by tracking how often markers separate during meiosis. Plant breeders use the same concept when they follow favourable allele combinations across generations. Medical genetics uses linkage analysis in families when researchers need to track a disease locus with nearby markers.
Genome mapping extends this idea across many markers. OpenStax describes linkage analysis as studying recombination frequency between genes, with higher recombination indicating greater distance. Review the OpenStax genome mapping section.
This calculator models two loci with one recombination frequency. It does not estimate gene order, interference, coefficient of coincidence, or double-crossover correction. Three-point test crosses handle those questions better.
A recombination frequency near 50% does not prove that genes sit on different chromosomes. Distant genes on the same chromosome can also produce 50% observable recombination. Long intervals require extra markers and mapping functions.
This tool supports genetics education and research planning. It does not provide clinical genetic counselling, diagnostic interpretation, or professional breeding certification.
Use these tools to compare independent assortment, test crosses, and linked-gene inheritance models.