Mendelian Ratio Chi-Square Calculator

Test observed offspring counts against expected Mendelian ratios in real time. Use it for monohybrid, dihybrid, trihybrid, test cross, and incomplete dominance data. The tool reports χ², degrees of freedom, p-value, expected counts, and the phenotype class that contributes most to deviation.

Live offspring ratio chi-square test

Choose a ratio preset, enter your observed offspring counts, and watch the statistical test update instantly without a submit button.

Choose an expected Mendelian ratio

Load a common cross, then edit the phenotype labels, observed counts, or expected ratio values.

Monohybrid F₂

Use this for flower colour, seed shape, or any single-gene complete dominance cross.

Observed offspring counts

Enter the real counts from your cross. Use whole offspring counts, not percentages.

Expected ratio and test settings

Enter the theoretical ratio from your genetic hypothesis, such as 3:1 or 9:3:3:1.

Dominant phenotype
Recessive phenotype
Mendelian ratio bar showing expected phenotype classes31Expected Mendelian ratioEach coloured segment represents one phenotype class before sampling noise changes the observed counts.

Live result

Observed counts fit the expected ratio

Do not reject H₀. The deviations fit normal sampling variation for this ratio.

χ²

0.053

df

1

p-value

0.817

Observed vs expected table

The contribution column shows which phenotype class drives the χ² statistic.

ClassObservedRatioExpectedO − Eχ² contribution
Dominant phenotype7637510.013
Recessive phenotype24125-10.040

Decision guide

Chi-square goodness-of-fit decision curveLow χ²High χ² tailGoodness-of-fit test

Null hypothesis: The observed offspring counts follow the expected Mendelian ratio.

Alternative hypothesis: The counts deviate more than expected from random sampling.

Largest contribution: Recessive phenotype adds 0.040 to χ².

Contribution bars

Longer bars identify the classes where observed counts diverge most from the expected ratio.

Dominant phenotype0.013
Recessive phenotype0.040
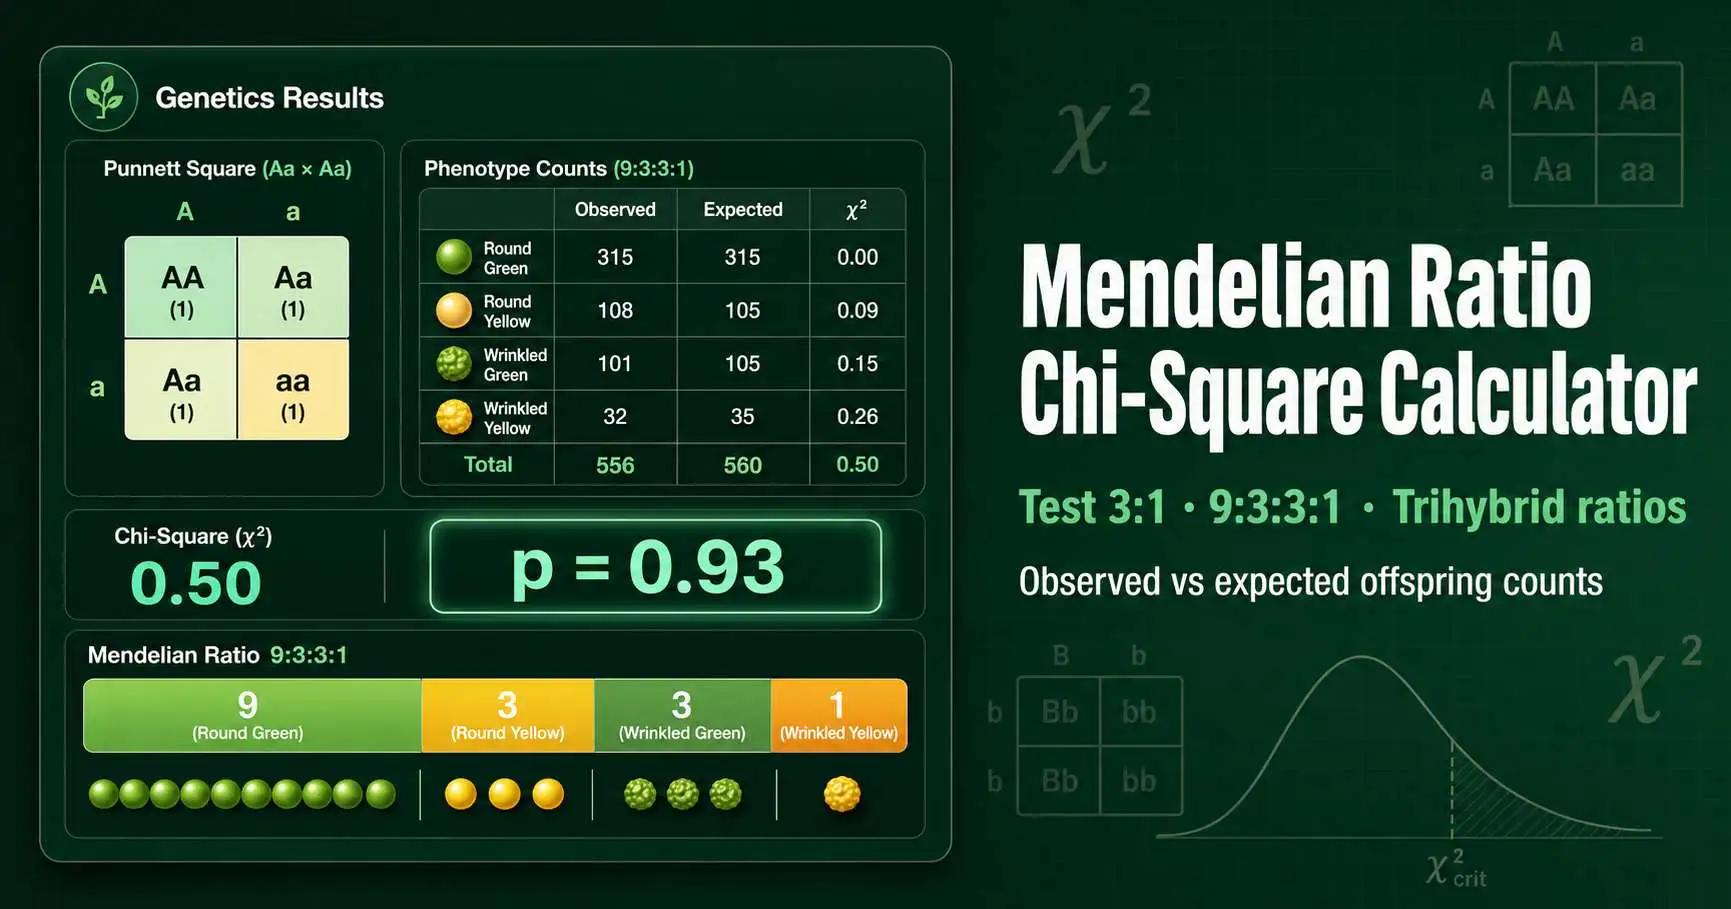
Mendelian ratio chi-square diagram showing pea offspring phenotype counts, expected ratios, and chi-square goodness-of-fit comparison
Figure 1. A Mendelian offspring ratio test connects visible pea phenotypes with molecular loci such as SBEI, which encodes starch-branching enzyme I and explains the wrinkled seed phenotype in Pisum sativum. The diagram shows how observed classes become expected counts before the chi-square goodness-of-fit statistic tests segregation and independent assortment.

What is a Mendelian ratio chi-square test?

A Mendelian ratio chi-square test compares observed offspring counts with a ratio predicted by a genetic model. Gregor Mendel published his pea hybridisation work in 1866, long before biologists connected chromosomes, meiosis, and genes. Karl Pearson later introduced the chi-square test in 1900, giving geneticists a formal way to ask whether count data fit an expectation.

The test uses the formula (O − E)2 / E for each phenotype class. O means observed count, while E means expected count. The calculator adds those class contributions into one χ² statistic and converts it into a p-value using the chi-square distribution.

In a monohybrid Aa × Aa cross, meiosis separates A and a alleles into gametes. Random fertilisation then creates a 3:1 phenotype ratio under complete dominance. OpenStax summarises the same segregation and independent assortment logic in its genetics chapter on inheritance laws. Read the OpenStax inheritance overview.

How to use the calculator

  1. 1

    Choose a Mendelian ratio

    Select a preset such as 3:1, 1:1, 1:2:1, 9:3:3:1, or 27:9:9:9:3:3:3:1.

  2. 2

    Enter observed counts

    Type the counted offspring number for each phenotype class. Use raw counts rather than percentages.

  3. 3

    Check expected values

    Review the expected counts that the calculator derives from the ratio and total offspring number.

  4. 4

    Interpret the p-value

    Compare the p-value with α. Do not reject the ratio when p is greater than or equal to α.

For genotype notation, use uppercase letters for dominant alleles and lowercase letters for recessive alleles. Examples include Aa, AaBb, and AaBbCc. For phenotype labels, use clear class names such as A_B_, A_bb, aaB_, and aabb.

Mendelian ratios for monohybrid, dihybrid, and trihybrid crosses

A 3:1 ratio fits a single-gene F2 cross when one allele shows complete dominance. A 1:2:1 ratio fits genotype counts or incomplete dominance, because the heterozygote forms its own class. A 1:1 ratio fits a monohybrid test cross such as Aa × aa.

Dihybrid ratios add a second locus. AaBb × AaBb produces 9:3:3:1 when both genes assort independently and each gene shows complete dominance. AaBb × aabb produces 1:1:1:1 when the heterozygous parent makes AB, Ab, aB, and ab gametes at equal frequency.

Trihybrid F2 data often use 27:9:9:9:3:3:3:1. That ratio contains eight phenotype classes and a rare triple-recessive class at 1/64 of the total. Small samples can miss that class by chance, so trihybrid chi-square tests need more offspring than monohybrid tests.

Cross typeExampleExpected ratioClasses
Monohybrid F₂Aa × Aa3:1Dominant and recessive phenotypes
Test crossAa × aa1:1Two phenotype classes
Dihybrid F₂AaBb × AaBb9:3:3:1Four phenotype classes
Trihybrid F₂AaBbCc × AaBbCc27:9:9:9:3:3:3:1Eight phenotype classes

Worked examples

Example 1: monohybrid 3:1 ratio

A class counts 76 dominant offspring and 24 recessive offspring from Aa × Aa. The total equals 100. A 3:1 ratio predicts 75 dominant and 25 recessive offspring.

χ² = (76 − 75)2 / 75 + (24 − 25)2 / 25 = 0.053. With 1 degree of freedom, p is about 0.82. The observed counts fit the expected 3:1 ratio at α = 0.05.

Example 2: dihybrid 9:3:3:1 ratio

A dihybrid F2 cross gives 315 A_B_, 108 A_bb, 101 aaB_, and 32 aabb offspring. The total equals 556. A 9:3:3:1 ratio predicts 312.75, 104.25, 104.25, and 34.75 offspring.

The class contributions sum to χ² ≈ 0.47. With 3 degrees of freedom, p is about 0.93. These counts support independent assortment for the two loci under this simple model.

Practical value in genetics labs and breeding

Biology students use chi-square tests to decide whether real offspring counts support a proposed cross. The method also helps breeders compare observed seed, coat, or flower phenotypes with a planned inheritance model. A rejected ratio can guide the next experiment, especially when two genes may show linkage or epistasis.

Molecular genetics gives those classical ratios a physical basis. Bhattacharyya, Smith, Ellis, Hedley, and Martin showed in 1990 that Mendel’s wrinkled pea seed phenotype traces to a transposon-like insertion in a gene encoding starch-branching enzyme. That discovery connected a visible 3:1 trait with starch biosynthesis in the developing seed. View the PubMed record.

For teaching statistics, the same workflow matches the general chi-square goodness-of-fit framework. OpenStax Statistics describes how observed and expected categorical counts drive the χ² statistic. Review the OpenStax goodness-of-fit method.
Limitations and caveats

A chi-square test does not prove that a genetic model works. It only measures whether your observed counts deviate more than expected under that model. A non-significant result can still hide weak linkage, incomplete penetrance, or phenotype scoring error.

Expected counts below 5 weaken the chi-square approximation. This problem appears often in trihybrid crosses, rare phenotypes, and small classroom data sets. Combine classes only when biological logic supports that choice.

This calculator supports education and research planning. It does not provide clinical genetic advice, diagnostic interpretation, or professional breeding certification.

Frequently asked questions

What does a Mendelian ratio chi-square calculator test?
A Mendelian ratio chi-square calculator tests whether observed offspring counts match an expected genetic ratio. The null hypothesis says the data follow ratios such as 3:1, 1:1, 1:2:1, or 9:3:3:1. The calculator converts ratio values into expected counts, then sums (O − E)2 / E for every phenotype class. A high p-value supports normal sampling variation, while a low p-value suggests that the expected ratio may not explain the data.
Which Mendelian ratios can I test with this calculator?
You can test any ratio that uses two or more phenotype classes. Common examples include 3:1 for a monohybrid F2 cross, 1:1 for a test cross, and 1:2:1 for genotype or incomplete dominance data. Dihybrid crosses often use 9:3:3:1, while dihybrid test crosses use 1:1:1:1. Trihybrid F2 crosses use 27:9:9:9:3:3:3:1 when all three loci assort independently.
What p-value shows that a Mendelian ratio fits?
Most teaching labs use α = 0.05 as the decision threshold. If p ≥ 0.05, you do not reject the Mendelian ratio because the observed deviation fits ordinary sampling error. If p < 0.05, the data deviate more than expected under the ratio. That result can point to linkage, selection, scoring error, small sample size, or an incorrect genetic model.
How do I calculate expected counts from a ratio?
Add all parts of the expected ratio first. For a 9:3:3:1 ratio, the total equals 16 parts. If you counted 160 offspring, the expected counts equal 90, 30, 30, and 10. The calculator performs this conversion for every row, so it accepts ratios rather than requiring precomputed expected numbers.
Why does a dihybrid cross produce a 9:3:3:1 ratio?
A standard AaBb × AaBb cross produces a 9:3:3:1 phenotype ratio when both genes assort independently and show complete dominance. Each parent makes AB, Ab, aB, and ab gametes at equal frequency. Sixteen fertilisation combinations then collapse into four phenotype classes. Linkage, epistasis, or reduced viability can move real data away from 9:3:3:1.
Can I use this tool for trihybrid ratios?
Yes. A trihybrid F2 cross from AaBbCc × AaBbCc uses eight phenotype classes. The expected ratio equals 27:9:9:9:3:3:3:1 under complete dominance and independent assortment. The calculator includes this preset and lets you edit every class. Large trihybrid tests need larger sample sizes because the rare triple-recessive class has only 1/64 of the expected offspring.
What are the degrees of freedom for a genetics chi-square test?
For a simple Mendelian goodness-of-fit test, degrees of freedom usually equal the number of phenotype classes minus one. A 3:1 monohybrid test has 1 degree of freedom. A 9:3:3:1 dihybrid test has 3 degrees of freedom. This calculator uses that classroom convention because the expected ratio comes from a genetic hypothesis rather than from parameters estimated from the same offspring counts.
Can a significant chi-square result prove genetic linkage?
No. A significant result shows that observed counts depart from the expected ratio, not why they depart. Genetic linkage can distort a dihybrid test cross away from 1:1:1:1, but selection, penetrance, sample size, and phenotype scoring can create similar patterns. You need recombination data or a linkage analysis to estimate map distance in centimorgans. Treat this calculator as a first diagnostic step, not a final genetic map.

Use these tools before or after a chi-square test to connect the genetic cross with the statistical result.