Epistasis Punnett Square Calculator for Modified Dihybrid Ratios

Calculate epistasis ratios from an AaBb × AaBb cross and see how gene interaction changes the classic 9:3:3:1 pattern. The tool covers 9:3:4, 12:3:1, 15:1, 9:7, 13:3, and 9:6:1 ratios with live expected counts, phenotype grouping, and chi-square comparison.

Epistasis Punnett Square Calculator

Select a gene interaction model, enter observed offspring counts, and compare your data with the expected modified dihybrid ratio.

Choose an epistasis ratio model

Each preset starts with an AaBb × AaBb cross, then groups the 16 Punnett boxes by the selected gene interaction.

Gene interaction model

Select the modified dihybrid ratio that matches the biological relationship between the two genes.

Recessive epistasis

A homozygous recessive genotype at one locus masks the second locus.

Expected F₂ ratio: 9:3:4

Classic example: Labrador coat colour logic, where ee blocks pigment deposition.

Gene Afirst locusGene Bsecond locusPhenotypevisible trait9:3:4 modified dihybrid ratioA homozygous recessive genotype at one locus masks the second locus.

Observed offspring counts

Use real offspring counts to test whether your data fit the selected epistasis ratio.

Live epistasis result

Recessive epistasis gives a 9:3:4 F₂ ratio

The largest expected phenotype class is A_B_ phenotype at 56.25%. Your observed counts fit this model at α = 0.05.

χ²

0

df

2

p-value

1.000

Punnett square grouped by epistasis class

Each AaBb × AaBb genotype box keeps its genotype, while the colour shows the phenotype class after gene interaction.

♀ × ♂
AB
Ab
aB
ab
AB

AABB

A_B_

AABb

A_B_

AaBB

A_B_

AaBb

A_B_

Ab

AABb

A_B_

AAbb

A_bb

AaBb

A_B_

Aabb

A_bb

aB

AaBB

A_B_

AaBb

A_B_

aaBB

aa__

aaBb

aa__

ab

AaBb

A_B_

Aabb

A_bb

aaBb

aa__

aabb

aa__

Epistasis probability cards

The ratio values convert directly into expected probabilities and offspring counts.

A_B_ phenotype

Both loci carry a dominant allele, so the downstream phenotype appears.

56.25%

ratio 9

A_bb phenotype

The A locus remains active, but bb changes the second trait state.

18.75%

ratio 3

aa masked phenotype

The aa genotype hides the B locus, so aaB_ and aabb combine.

25.00%

ratio 4

Observed, expected, and χ² contribution table

Phenotype classRatioProbabilityObservedExpectedO − Eχ² contribution
A_B_ phenotype956.25%909000
A_bb phenotype318.75%303000
aa masked phenotype425.00%404000
A_B_ phenotype0
A_bb phenotype0
aa masked phenotype0
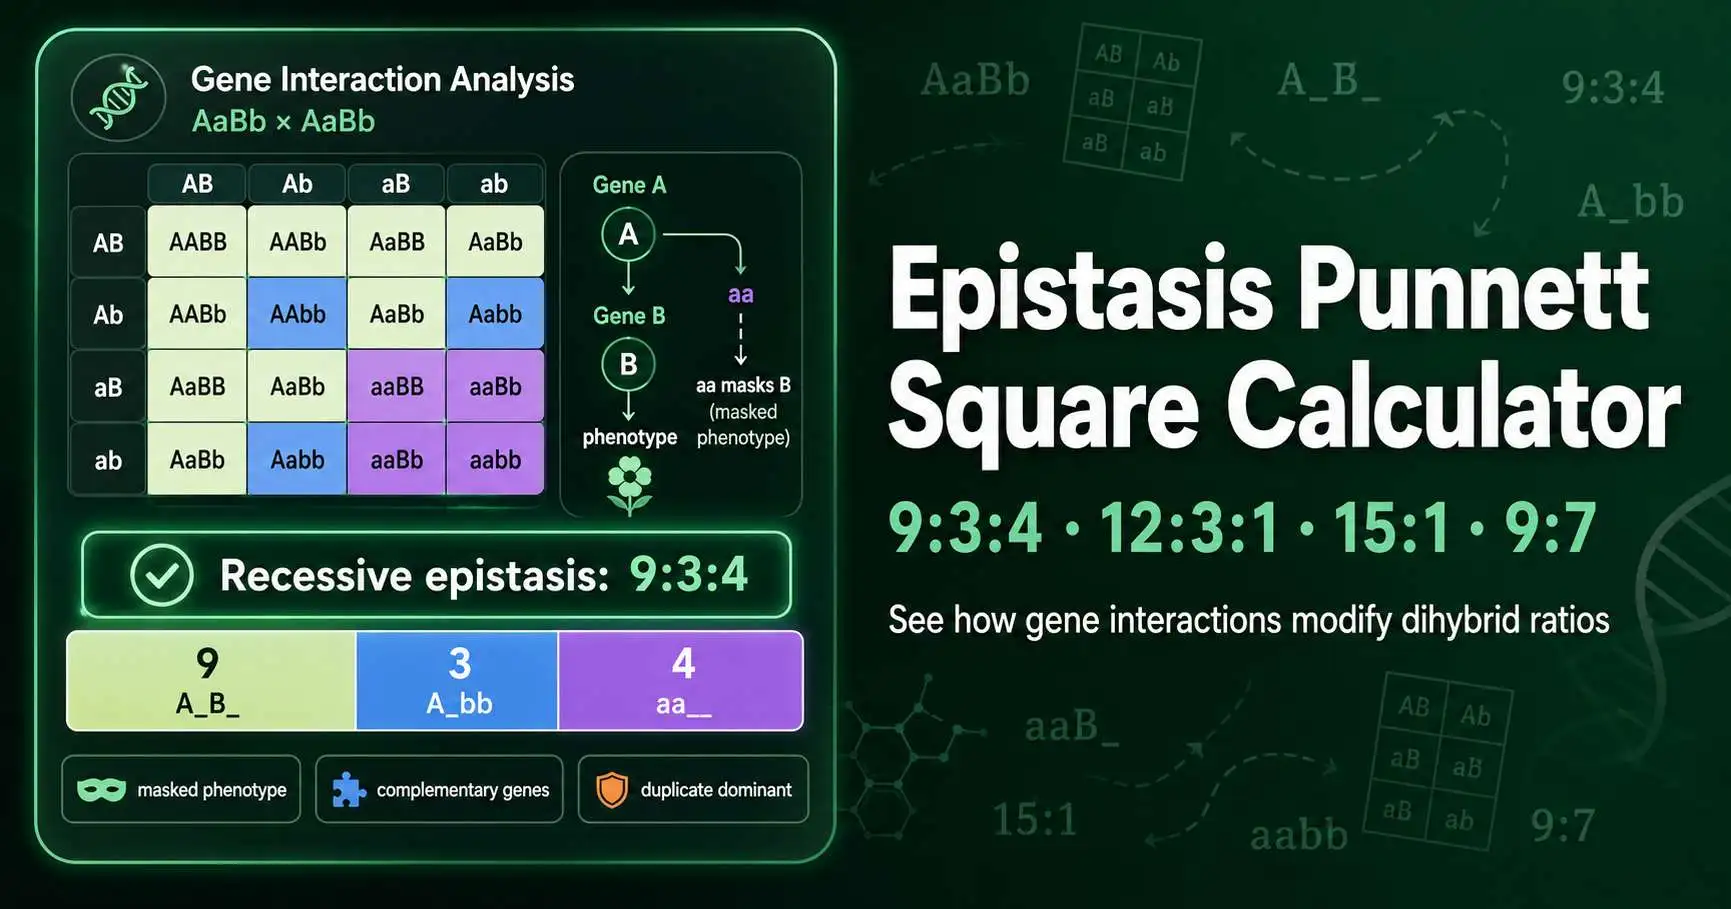
Epistasis Punnett square diagram showing an AaBb by AaBb cross grouped into modified dihybrid phenotype ratios such as 9 to 3 to 4 and 9 to 7
Figure 1. Epistasis groups AaBb × AaBb genotype classes by functional gene interaction rather than by separate traits. Pathway genes such as A and B can encode enzymes, regulators, or transport proteins, so recessive loss or dominant suppression can merge several genotype boxes into one phenotype class.

What is an Epistasis Punnett Square Calculator?

An epistasis Punnett square calculator explains why some two-gene crosses do not produce the standard 9:3:3:1 F2 ratio. It begins with the same AaBb × AaBb genotype grid, then collapses genotype boxes when one gene masks or modifies another gene. Students use it when textbook ratios such as 9:3:4 or 9:7 appear without a clear visual map.

William Bateson used the term epistasis in the early twentieth century while studying gene interactions that changed visible inheritance patterns. Modern genetics treats epistasis as interaction between loci, proteins, or pathway steps. Phillips reviewed this concept in 2008 and described epistasis as a central feature of genetic architecture. Read the Phillips epistasis review.

Epistasis differs from dominance because dominance compares alleles at one locus. Epistasis compares effects across loci. A recessive aa genotype can hide B/b, while a dominant A allele can suppress the second locus in a different model.

How to use Epistasis Punnett Square Calculator

  1. 1

    Select an epistasis ratio model

    Choose a model such as recessive epistasis 9:3:4, dominant epistasis 12:3:1, complementary genes 9:7, or duplicate dominant epistasis 15:1.

  2. 2

    Review the AaBb × AaBb Punnett square

    Check how the 16 genotype boxes group into phenotype classes under the selected gene interaction.

  3. 3

    Enter observed phenotype counts

    Type the counted offspring number for each visible phenotype class rather than using percentages.

  4. 4

    Compare observed and expected epistasis counts

    Use the probability cards, expected counts, and chi-square p-value to decide whether the selected ratio fits your data.

Use phenotype counts that match the selected model. For a 9:3:4 recessive epistasis test, enter counts for A_B_, A_bb, and aa__ rather than four separate 9:3:3:1 classes.

What each part of the Epistasis Punnett Square Calculator does

Epistasis ratio presets

These buttons load common modified dihybrid ratios. Each preset changes how the 16 AaBb × AaBb genotype boxes collapse into phenotype groups.

Gene interaction card

This card defines the selected model, names the expected F2 ratio, and explains which gene masks, complements, or suppresses the other gene.

Observed offspring inputs

These inputs let you test real phenotype counts. The tool converts the selected ratio into expected counts and updates χ² without a calculate button.

Grouped Punnett square

The coloured grid keeps every genotype visible, then labels the epistatic phenotype group. This helps students see why classes merge.

Probability cards and chi-square table

The cards show ratio values, percentages, and expected counts. The table shows observed minus expected values, so you can identify which phenotype class drives the deviation.

Epistasis ratios in AaBb × AaBb dihybrid crosses

A standard dihybrid cross produces 9:3:3:1 when two genes assort independently and affect separate traits. OpenStax explains this independent assortment model through the laws of inheritance. Review the OpenStax inheritance section.

Epistasis keeps independent assortment but changes phenotype interpretation. Recessive epistasis gives 9:3:4 when a homozygous recessive genotype masks another locus. Dominant epistasis gives 12:3:1 when one dominant allele blocks expression downstream.

Duplicate dominant epistasis gives 15:1 because either gene can produce the dominant phenotype. Complementary genes give 9:7 because both genes need a dominant allele. Dominant and recessive epistasis gives 13:3 when one dominant genotype class and the double recessive class share the same phenotype.

Epistasis typeModified ratioClass groupingBiological meaning
Recessive epistasis9:3:4A_B_, A_bb, aa__aa masks the second locus
Dominant epistasis12:3:1A___, aaB_, aabbA masks B/b
Duplicate dominant15:1A___ or __B_, aabbEither dominant gene works
Complementary genes9:7A_B_, all othersBoth dominant loci are required
Dominant and recessive13:3A___ or aabb, aaB_Suppression and double loss merge

Worked examples for epistasis Punnett square ratios

Example 1: recessive epistasis 9:3:4

A researcher counts 90 A_B_, 29 A_bb, and 41 aa__ offspring from an AaBb × AaBb cross. The total equals 160. A 9:3:4 model predicts 90, 30, and 40 offspring.

The deviations equal 0, −1, and +1. χ² stays near 0.06 with 2 degrees of freedom, so the data support the 9:3:4 model at α = 0.05.

Example 2: complementary genes 9:7

A pigment pathway gives 92 coloured offspring and 68 colourless offspring. A 9:7 ratio with 160 total offspring predicts 90 coloured and 70 colourless offspring.

This pattern fits two required genes in the same pathway. A recessive block at either locus prevents the final pigment, so A_bb, aaB_, and aabb merge.

Why epistasis ratios matter in genetics and breeding

Epistasis helps explain why two traits can fail to behave like separate Mendelian characters. Plant breeders use this idea when pigment, disease resistance, seed traits, or flowering time depend on interacting pathway genes. A modified ratio can point toward enzyme order, suppressor genes, or redundant genes.

Human genetics also uses epistasis as a model for gene-gene interaction, especially in complex traits. A single-locus calculator cannot capture those relationships. This page stays focused on two-locus classroom crosses, but the same logic prepares students for pathway genetics and quantitative trait analysis.

When epistasis results need more evidence

A good ratio fit does not prove the molecular pathway. Several models can produce similar phenotype counts when sample size stays small. Linkage, incomplete penetrance, environmental effects, and scorer bias can also shift F2 classes.

Rare classes need enough expected offspring. A 15:1 ratio expects 1 recessive phenotype per 16 offspring, so a small family or seed tray may miss it by chance. Use follow-up crosses, molecular markers, or enzyme assays when the biological conclusion matters.

This calculator supports genetics education and experiment planning. It does not replace professional genetic counselling, diagnostic testing, or validated breeding decisions.
Epistasis Punnett Square Calculator FAQs

What does an epistasis Punnett square calculator do?
An epistasis Punnett square calculator starts with a two-gene cross such as AaBb × AaBb. It builds the 16 genotype boxes, then groups those genotypes by gene interaction. Standard independent assortment gives 9:3:3:1, while epistasis can collapse those four classes into ratios such as 9:3:4, 12:3:1, 15:1, 9:7, or 13:3. The calculator also compares observed offspring counts with the selected ratio through a chi-square goodness-of-fit test.
Why does epistasis change the 9:3:3:1 dihybrid ratio?
A 9:3:3:1 ratio assumes that the two genes affect separate visible traits. Epistasis changes that assumption because one gene masks, blocks, or modifies the effect of another gene. In recessive epistasis, aa can hide the B locus and merge aaB_ with aabb into one class. That collapse changes the expected F2 ratio from 9:3:3:1 to 9:3:4.
Which epistasis ratios does this calculator include?
The calculator includes recessive epistasis at 9:3:4, dominant epistasis at 12:3:1, duplicate dominant epistasis at 15:1, complementary genes at 9:7, dominant and recessive epistasis at 13:3, and additive gene interaction at 9:6:1. It also includes standard 9:3:3:1 as a comparison model. Each ratio comes from the same 16-box AaBb × AaBb Punnett square. The difference lies in how the genotype classes combine into phenotypes.
What is the difference between recessive epistasis and dominant epistasis?
Recessive epistasis needs two recessive alleles at the masking locus. A common classroom pattern uses aa to mask B/b, which produces 9:3:4. Dominant epistasis needs only one dominant allele at the masking locus. A single A allele can mask the B locus and produce a 12:3:1 ratio.
How do complementary genes create a 9:7 ratio?
Complementary genes create a 9:7 ratio when both genes need at least one dominant allele for the final phenotype. The A_B_ class forms the 9 part. The A_bb, aaB_, and aabb classes all lack one required pathway step, so they combine into the 7 part. This model fits a two-step biochemical pathway where each gene supplies a different required enzyme.
Can I use observed offspring counts in this epistasis calculator?
Yes. Enter observed counts for every phenotype class after choosing an epistasis model. The calculator converts the selected ratio into expected counts and reports χ², degrees of freedom, and a p-value. A p-value at or above 0.05 often supports the selected ratio in teaching labs. A lower value suggests that your offspring counts need another explanation, such as linkage, scoring error, viability selection, or the wrong gene interaction model.
Does epistasis mean the genes are linked on the same chromosome?
No. Epistasis describes functional interaction between genes, not physical distance on a chromosome. Two epistatic genes can assort independently and still produce a modified F2 ratio. Linkage changes gamete frequencies because loci sit near each other on the same chromosome. Epistasis changes phenotype grouping after fertilisation because one gene changes how another gene appears.
What sample size works best for epistasis ratio testing?
Larger samples give more reliable chi-square tests because rare phenotype classes need enough expected offspring. A 15:1 ratio expects only 1/16 of offspring in the recessive class. With 32 offspring, that class has an expected count of only 2, which weakens the chi-square approximation. With 160 offspring, the same class has an expected count of 10, which supports a more stable classroom test.

Use these calculators to compare standard Mendelian expectations with modified gene interaction ratios.