Genetic Drift Simulator for Allele Frequency Change

Simulate neutral genetic drift in finite diploid populations. Adjust population size, starting allele frequency, generation count, replicate populations, and bottleneck events. The simulator shows allele fixation, allele loss, polymorphism, and heterozygosity change in real time.

Genetic Drift Simulator with fixation and allele-loss results

Start with a preset or build your own neutral drift scenario. Results update as soon as an input changes.

Choose a genetic drift scenario

Load a preset, then adjust population size, starting allele frequency, and generation count.

Population and allele settings

Genetic drift samples 2N allele copies in each diploid generation.

Bottleneck and random seed

A bottleneck temporarily reduces N and increases sampling error in that generation.

Random allele sampling in a finite populationFinite population samplingParent allele poolNext generation sample

Live simulation result

Allele A most often disappears

In this run, 50.0% of replicate populations match the leading outcome after 50 generations.

Mean final frequency

0.282

average p after drift

Allele frequency trajectories

Each line represents one replicate population sampled across generations.

Genetic drift allele frequency trajectories0.000.250.500.751.00GenerationAllele A frequency

Allele A fixed

16.7%

p reached 1.00

Allele A lost

50.0%

p reached 0.00

Still polymorphic

33.3%

0 < p < 1

Heterozygosity after drift

Genetic drift reduces expected heterozygosity because allele copies share more recent ancestors in small populations.

Start H

0.500

Expected H after 50 generations

0.182

Mean simulated H

0.130

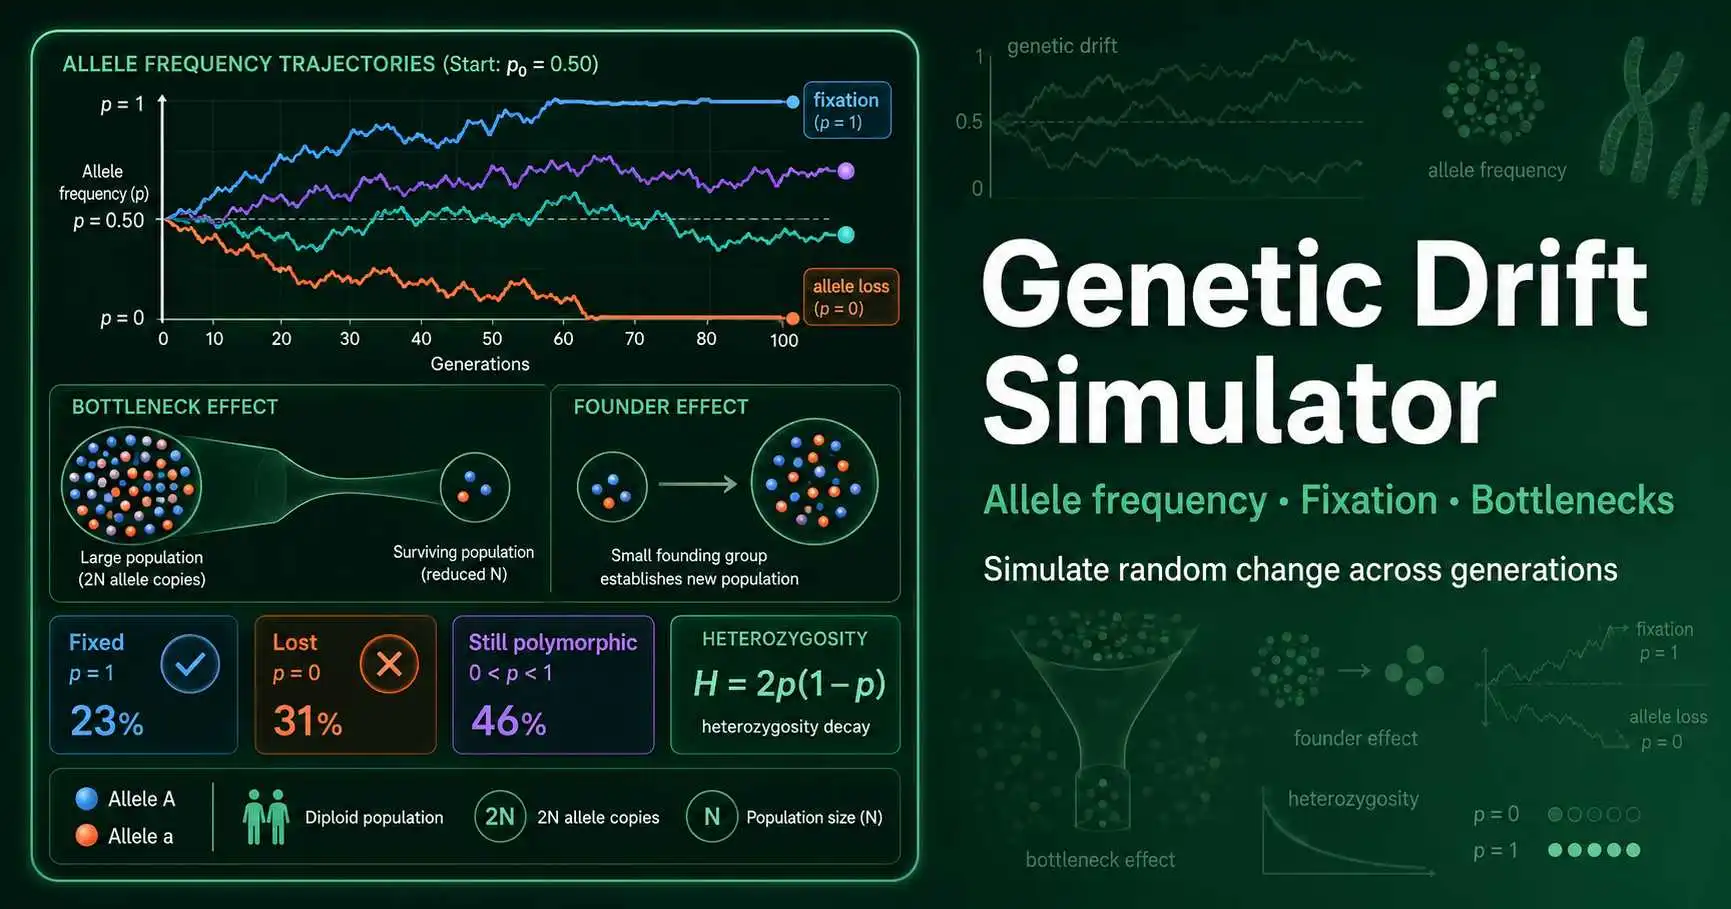
Genetic drift simulation diagram showing allele frequency trajectories, fixation, loss, bottleneck effect, and heterozygosity decay
Figure 1. Genetic drift changes allele frequencies through random sampling of allele copies across generations. The diagram shows allele A and allele a in finite diploid populations, fixation at p = 1, allele loss at p = 0, bottleneck-driven sampling error, and heterozygosity decay measured as 2p(1 − p).

What is genetic drift in population genetics?

Genetic drift changes allele frequency through chance sampling. It does not require natural selection, fitness differences, mutation, or migration. Sewall Wright developed stochastic population-genetic models that helped explain why allele frequencies can wander in finite populations.

A diploid population with N individuals carries 2N allele copies at an autosomal locus. Each generation samples those copies into offspring. Random sampling can increase allele A, decrease it, fix it, or remove it.

OpenStax describes genetic drift as a force that affects small populations more strongly than large populations. Its population genetics chapter also connects drift with bottleneck and founder effects. Read the OpenStax population genetics section.

What each part of Genetic Drift Simulator does

Population size N control

This field sets the diploid population size. The simulator samples 2N allele copies each generation, so smaller N creates stronger drift.

Starting allele frequency slider

This slider sets p₀ for allele A. Rare alleles start with fewer copies, so random loss becomes more common.

Trajectory graph

Each line represents one replicate population. Lines reaching the top show fixation, while bottom lines show loss.

Bottleneck switch

This option reduces N during one generation. It models a temporary crash that magnifies sampling error.

Fixation and loss cards

These cards summarize how many replicate populations fixed allele A, lost allele A, or stayed polymorphic.

Heterozygosity panel

This panel reports expected and simulated heterozygosity. Lower values show reduced genetic variation.

How to use Genetic Drift Simulator

  1. 1

    Set the starting allele frequency

    Choose p₀ for allele A, such as 0.50 for equal A and a frequencies or 0.10 for a rare allele.

  2. 2

    Choose diploid population size

    Enter N, the number of diploid individuals. The simulator samples 2N allele copies each generation.

  3. 3

    Pick generations and replicate populations

    Increase generations to watch long-term drift, and increase replicate populations to compare many random paths.

  4. 4

    Add a bottleneck if needed

    Switch on the bottleneck setting to reduce N for one generation and see how random sampling intensifies.

  5. 5

    Read fixation, loss, and heterozygosity

    Use the result cards to compare allele fixation, allele loss, remaining polymorphism, and heterozygosity decay.

Genetic drift examples with small and large populations

Example 1: N = 25 with p₀ = 0.50

A population with 25 diploid individuals carries 50 allele copies. If p₀ = 0.50, the starting pool has about 25 A copies and 25 a copies. After 50 generations, several replicate populations may reach fixation or loss.

The expected starting heterozygosity equals 2 × 0.50 × 0.50 = 0.50. Drift reduces that value as replicate populations move toward p = 0 or p = 1.

Example 2: N = 250 with p₀ = 0.50

A population with 250 diploid individuals carries 500 allele copies. Random sampling still changes p, but each generation samples a much larger allele pool. Most trajectories stay nearer 0.50 over the same time span.

This comparison shows why conservation genetics focuses on effective population size. Smaller breeding populations lose allelic variation faster, even when every allele behaves neutrally.

Genetic drift bottleneck effect and founder effect

A bottleneck effect occurs when a population passes through a temporary size crash. The surviving individuals carry only part of the original allele pool. That random subset can reshape allele frequencies quickly.

A founder effect begins when a small group starts a new population. The new population may carry allele frequencies that differ from the source population. Both effects amplify drift because few allele copies define the next gene pool.

Nature Education explains that genetic drift changes allele frequencies unpredictably, while larger population size reduces sampling error. Review genetic drift and effective population size.

Why genetic drift matters in conservation and evolution

Genetic drift helps explain why isolated populations lose variation. Conservation biologists track this process because reduced heterozygosity can limit future adaptive potential. Drift can also make rare alleles common by chance.

In laboratory evolution, replicate populations often diverge even under identical conditions. Drift gives each replicate its own random history. That variation can complicate interpretation when population size stays small.

Drift also connects directly to Hardy-Weinberg equilibrium. Hardy-Weinberg assumes an infinitely large population or negligible sampling error. Finite populations violate that assumption every generation.

Genetic Drift Simulator assumptions and model scope

This simulator models neutral allele sampling at one autosomal locus. It does not include selection, dominance, migration, mutation, assortative mating, or overlapping generations. Those forces can change real populations at the same time.

The bottleneck setting reduces population size for one generation only. Real bottlenecks may last many generations, change survival, or interact with inbreeding. Use this page as a teaching model, not a full demographic forecast.

Genetic Drift Simulator FAQs

What does the Genetic Drift Simulator show?
The Genetic Drift Simulator shows how allele frequency changes by random sampling in a finite population. It starts with allele A at a chosen frequency, then samples 2N allele copies in each diploid generation. The trajectory lines show independent replicate populations. Some lines reach p = 1, which means fixation, while others reach p = 0, which means allele loss.
Why does genetic drift affect small populations more strongly?
Small populations contain fewer allele copies, so random sampling error has a larger effect each generation. In a diploid population with N = 25, the simulator samples only 50 allele copies. In a population with N = 250, it samples 500 allele copies. Larger samples usually stay closer to the starting frequency, so drift moves more slowly.
What does allele fixation mean in genetic drift?
Allele fixation means one allele reaches frequency 1.00 in the simulated population. After fixation, every allele copy at that locus carries the same allele. Neutral fixation does not require natural selection or an adaptive advantage. Random sampling alone can fix an allele, especially when N stays small for many generations.
What does allele loss mean in the simulator?
Allele loss means allele A reaches frequency 0.00. Once a neutral allele disappears, drift cannot restore it unless mutation or migration introduces it again. Rare alleles face higher loss risk because they begin with fewer copies. A starting frequency of p = 0.10 gives the allele fewer chances to survive sampling than p = 0.50.
How does a bottleneck change allele frequency?
A bottleneck temporarily reduces population size. The simulator lowers N during one selected generation, then returns N to its original value. That single small sample can push allele frequency sharply upward or downward. Bottlenecks also reduce genetic variation because many allele copies fail to pass through the narrow population stage.
What is heterozygosity in genetic drift?
Heterozygosity measures the expected proportion of heterozygotes at a locus under random mating. For two alleles, expected heterozygosity equals 2p(1 − p). Drift reduces heterozygosity over time because populations lose alleles or move toward fixation. The simulator reports starting H, expected H, and mean simulated H after the final generation.
Does this simulator include natural selection?
No. This Genetic Drift Simulator models neutral drift only. Allele A and allele a have equal fitness, so frequency changes come from random sampling rather than survival or reproduction differences. That design helps students isolate drift from selection, mutation, and migration. Use a selection coefficient calculator when you need genotype fitness values.
Why do repeated genetic drift runs give different results?
Genetic drift is stochastic, so replicate populations follow different paths even when N and p₀ stay the same. One run may fix allele A, while another loses it. The simulator uses many replicate populations to show this spread. The “New random sample” button changes the random seed without changing the biology settings.

Use these tools to compare drift with Hardy-Weinberg expectations and mutation-driven allele input.