Mutation Rate Calculator

Estimate mutation rate from observed mutant counts, background controls, screened cells, generations, and target length. The calculator reports per-locus rate, per-base rate, scaled rates, and a Poisson confidence interval for rare mutation events.

Live mutation rate calculator from observed mutant counts

Load a preset assay or enter your own data. Results update as you change counts, generations, or target size.

Choose a mutation rate scenario

Load a common genetics assay, then edit the counts, population size, generations, and target length.

Bacterial reversion assay

Estimate a locus-level mutation rate from counted revertant colonies.

Observed mutation data

Enter raw observed mutant counts and any background count from the control plate or control sample.

Corrected mutant count

38.0

observed mutants minus background mutants

Mutation opportunities

Mutation opportunities equal screened cells or genomes multiplied by generations or cell divisions.

DNA replication creates mutation opportunities across generationsReplication opportunitiesEach copied base or locus creates a chance for a spontaneous or induced mutation.mutation event

Live mutation rate estimate

4.750 × 10^-8 per locus per generation

This estimate uses 38.0 corrected mutants across 800,000,000 mutation opportunities. The count is large enough for a more stable teaching estimate.

corrected

38.0

opportunities

8.00 × 10^+8

bp rate

3.96 × 10^-11

Mutation rate outputs

Per locus per generation

4.750 × 10^-8

Per base per generation

3.958 × 10^-11

Per million cells

4.750 × 10^-2

Per billion copied bases

3.958 × 10^-2

Poisson uncertainty range

Rare mutation counts follow counting noise. This interval approximates a 95% Poisson confidence range.

Per locus 95% interval

3.36 × 10^-8 to 6.52 × 10^-8

Per base 95% interval

2.80 × 10^-11 to 5.43 × 10^-11

Scaled mutation rate bars

Scaled outputs help compare a locus-level estimate with a base-pair-level estimate.

Per million cells4.75 × 10^-2 mutants
Per billion copied bases3.96 × 10^-2 mutations

Calculation table

QuantityFormulaValue
Corrected mutantsobserved − background38.0
Mutation opportunitiespopulation × generations800,000,000
Locus mutation ratecorrected mutants ÷ opportunities4.750 × 10^-8
Base-pair mutation ratelocus rate ÷ target bp3.958 × 10^-11
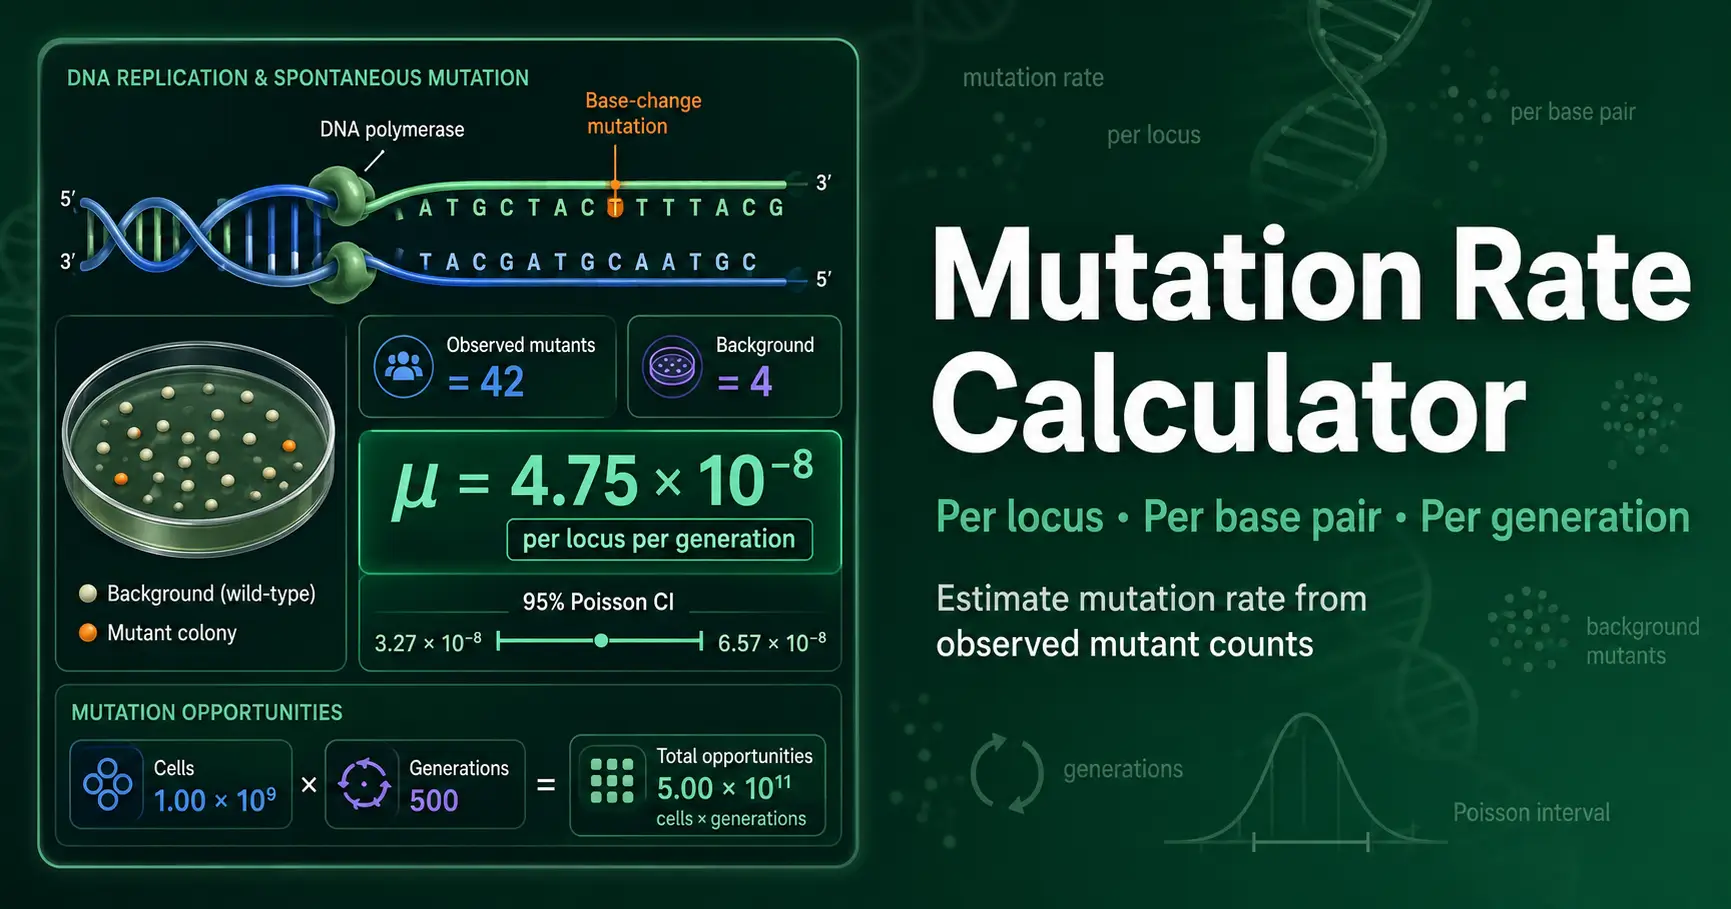
Mutation rate diagram showing DNA replication, observed mutant colonies, target gene length, and per-base mutation rate calculation
Figure 1. Mutation rate estimation connects DNA polymerase copying errors, DNA repair, and observed mutant counts. A locus such as CAN1 in yeast or a bacterial reversion marker can convert counted colonies into per-locus and per-base rates when population size, generations, and target length stay explicit.

What is mutation rate in genetics?

Mutation rate measures how often a new heritable DNA change appears during replication, cell division, or one organismal generation. A rate differs from a frequency because frequency counts mutants that already exist in the sampled population. Growth, selection, and bottlenecks can change frequency after the original mutation event.

Spontaneous mutations arise from replication errors, base damage, recombination errors, and imperfect DNA repair. OpenStax describes DNA polymerase mistakes, chemical mutagens, ultraviolet radiation, and repair mechanisms such as photoreactivation in its mutation chapter. Read the OpenStax mutation overview.

Researchers report mutation rates in several units. Microbial genetics often uses mutations per locus per generation. Sequencing studies often use mutations per base pair per generation. This calculator shows both, so colony screens and DNA sequence data can fit the same learning framework.
What each part of Mutation Rate Calculator does

Preset assay buttons

These buttons load realistic example values for reversion assays, yeast screens, sequencing panels, and small teaching data sets. They help students compare mutation-rate units quickly.

Observed mutation data card

This card records observed mutants and background mutants. The calculator subtracts background so untreated control events do not inflate the final rate.

Mutation opportunities card

This card defines the denominator. Cells screened, genomes sampled, or individuals observed must be multiplied by generations or divisions before rate estimation.

Target size input

Target size converts a locus-level rate into a per-base rate. Use the gene length, amplicon size, or sequencing panel length in base pairs.

Confidence interval panel

Mutation events often appear as rare counts. The Poisson interval shows how much small counts can move the estimated rate up or down.

Download PNG button

This button saves a compact result card for lab reports, classroom slides, or comparison between control and treatment conditions.

How to use Mutation Rate Calculator

  1. 1

    Enter observed mutant count

    Type the number of mutant colonies, sequence variants, or resistant cells detected in the assay.

  2. 2

    Subtract background mutants

    Add the control or untreated mutant count so the calculator can estimate the corrected mutation signal.

  3. 3

    Add mutation opportunities

    Enter screened cells, genomes, or individuals, then enter generations or cell divisions.

  4. 4

    Set target size in base pairs

    Use the gene, locus, amplicon, or sequencing panel length to convert the locus rate into a base-pair rate.

  5. 5

    Read the mutation rate outputs

    Compare the per-locus rate, per-base rate, scaled rates, and Poisson confidence interval.

Mutation rate calculation examples

Example 1: bacterial reversion assay

A plate shows 42 revertants, while the control shows 4 background revertants. The corrected count equals 38. If the experiment screened 100,000,000 cells through 8 generations, the opportunity count equals 800,000,000 cell-generations.

The locus rate equals 38 ÷ 800,000,000, or 4.75 × 10⁻⁸ per locus per generation. If the target contains 1,200 bp, the per-base estimate equals 3.96 × 10⁻¹¹ per base per generation.

Example 2: targeted sequencing panel

A sequencing panel detects 7 de novo variants across 5,000 individuals. Each individual contributes one generation, and the analysed target length equals 2,000,000 bp. The opportunity count equals 5,000 genome-generations for the locus panel.

The panel-level rate equals 7 ÷ 5,000, or 1.4 × 10⁻³ per panel per generation. Dividing by 2,000,000 bp gives 7.0 × 10⁻¹⁰ per base per generation.

Mutation rate calculator uses in genetics and evolution

Mutation introduces new alleles into populations. Population genetics then asks whether drift, selection, migration, or nonrandom mating changes those alleles after they arise. OpenStax explains mutation as one mechanism that can change allele frequencies, though many individual mutations remain neutral or rare.

Microbiology labs use mutation-rate estimates to compare untreated controls with chemical or radiation exposure. Cancer biology uses a related idea when it studies DNA repair deficiency and mutational load. Evolutionary genetics uses rate estimates to model molecular clocks, adaptation, and long-term genome stability.

Drake, Charlesworth, Charlesworth, and Crow reviewed spontaneous mutation rates across microbes, viruses, and eukaryotes in Genetics. Their 1998 review remains a widely cited source for comparing mutation-rate scales across organisms. Read the spontaneous mutation rate review.

When mutation rate estimates need extra care

This calculator uses a direct opportunity model. That model works well for classroom problems, selected colony screens, and first-pass sequencing estimates. It does not replace fluctuation-test methods for jackpot-prone microbial cultures.

Mutation detection also depends on assay sensitivity. A phenotype screen may miss synonymous variants, mild missense variants, lethal mutations, and mutations outside the scored target. A sequencing panel can miss low-level mosaic variants or regions with poor coverage.

Use this tool for genetics education, assay planning, and transparent rate calculations. Do not use it as a clinical diagnostic report or as the only evidence for mutagen safety decisions.

Mutation Rate Calculator FAQs

What does a mutation rate calculator estimate?
A mutation rate calculator estimates how often a new mutation appears per unit of heredity and time. This page reports mutation rate per locus per generation, per base pair per generation, per million cells, and per billion copied bases. The core formula divides corrected mutant count by mutation opportunities. A mutation opportunity usually means one screened genome, cell, individual, or locus copy across one generation or cell division.
How do I calculate mutation rate from observed mutant colonies?
Subtract background mutants from observed mutant colonies first. Then multiply the number of screened cells by the number of generations or cell divisions. Divide the corrected mutant count by that opportunity count. For example, 38 corrected mutants across 8 × 10⁸ cell-generations gives 4.75 × 10⁻⁸ mutations per locus per generation.
What is the difference between mutation rate and mutation frequency?
Mutation rate describes the probability of a new mutation during a generation, cell division, or replication cycle. Mutation frequency describes the proportion of mutants already present in a population at one time point. Selection, growth differences, bottlenecks, and clonal expansion can change frequency after the mutation occurs. This calculator estimates rate from counted events and explicit mutation opportunities.
Why does the calculator subtract background mutants?
Background subtraction removes mutants that appear in a control plate, untreated sample, or assay blank. This matters in reversion assays because spontaneous revertants can appear even without the treatment being tested. A treated plate with 42 revertants and a control with 4 revertants gives 38 corrected mutants. That corrected count better reflects the mutation signal assigned to the tested condition.
How do I convert a locus mutation rate to a per-base mutation rate?
Divide the locus-level mutation rate by the target size in base pairs. A locus rate of 4.75 × 10⁻⁸ across a 1,200 bp target equals about 3.96 × 10⁻¹¹ per base per generation. This conversion assumes every base in the target has equal opportunity to produce the counted phenotype. Real genes often contain hotspots, silent sites, and regions that the assay cannot detect.
Why does the calculator show a Poisson confidence interval?
Mutation counts often behave like rare count events. A sample with 3 corrected mutants carries much more random uncertainty than a sample with 300 corrected mutants. The Poisson interval shows how wide the likely rate range becomes when the count is small. Use this interval when comparing control and treatment rates, especially in mutagenesis screens.
Can this calculator analyse Luria-Delbruck fluctuation experiments?
This calculator gives a direct opportunity-based estimate, not a full fluctuation-test model. Luria-Delbruck experiments need special methods because jackpot mutations can arise early and expand into many descendant mutants. Those data rarely follow a simple Poisson distribution of final colony counts. Use this page for teaching, screening, and first-pass rate estimation, not final fluctuation analysis.
What sample size gives a reliable mutation rate estimate?
A larger corrected mutant count gives a narrower estimate. Fewer than 10 corrected mutants usually produce a wide interval, so the calculator marks that result as low confidence. Counts between 10 and 30 support a useful classroom estimate, but uncertainty remains visible. Replicate cultures, larger screened populations, and longer target regions improve precision.

Use these tools to connect mutation with allele-frequency change and population-level inheritance models.