Heterozygosity Calculator for Ho, He, and F

Calculate observed heterozygosity, expected heterozygosity, allele diversity, and inbreeding coefficient from genotype counts or allele-copy counts. Use Basic mode for SNP data. Use Advanced mode for microsatellites, multi-allelic markers, and pooled allele counts.

Calculate heterozygosity from genotype or allele counts

Enter observed counts and get live values for Ho, He, homozygosity, minor allele frequency, effective allele number, and F. The tool keeps the calculation visible so students can connect the formula with each result.

Example datasets

Load a preset, then edit the counts to match your own population sample.

Biallelic genotype counts

Enter observed counts for one diploid locus. Use sample counts, not percentages.

Observed heterozygosity Ho

42.00%

Observed heterozygotes divided by total individuals.

Expected heterozygosity He

42.78%

Hardy-Weinberg heterozygote expectation, 2pq.

Inbreeding coefficient F

0.0182

Positive values show heterozygote deficit.

Minor allele frequency

31.00%

The smaller allele frequency at this locus.

Observed and expected heterozygosity barsHeterozygosity comparisonObserved Ho42.0%Expected He42.8%Allele diversity rises when allele frequencies become more even.
Allele A frequency p69.0%
Allele a frequency q31.0%

Current interpretation

Observed and expected values are close

Ho is 42.00% and He is 42.78%. F equals 0.0182. Positive F values often reflect inbreeding, Wahlund effect, null alleles, or population subdivision. Negative values can appear when heterozygotes exceed random-mating expectations.

Hardy-Weinberg comparison

Expected counts use p², 2pq, and q² from the allele frequencies above.

Expected AA

47.61

N × p²

Expected Aa

42.78

N × 2pq

Expected aa

9.61

N × q²

χ² for these three genotype classes equals 0.0332. Use a dedicated Hardy-Weinberg test when you need a formal p-value and correction rules.

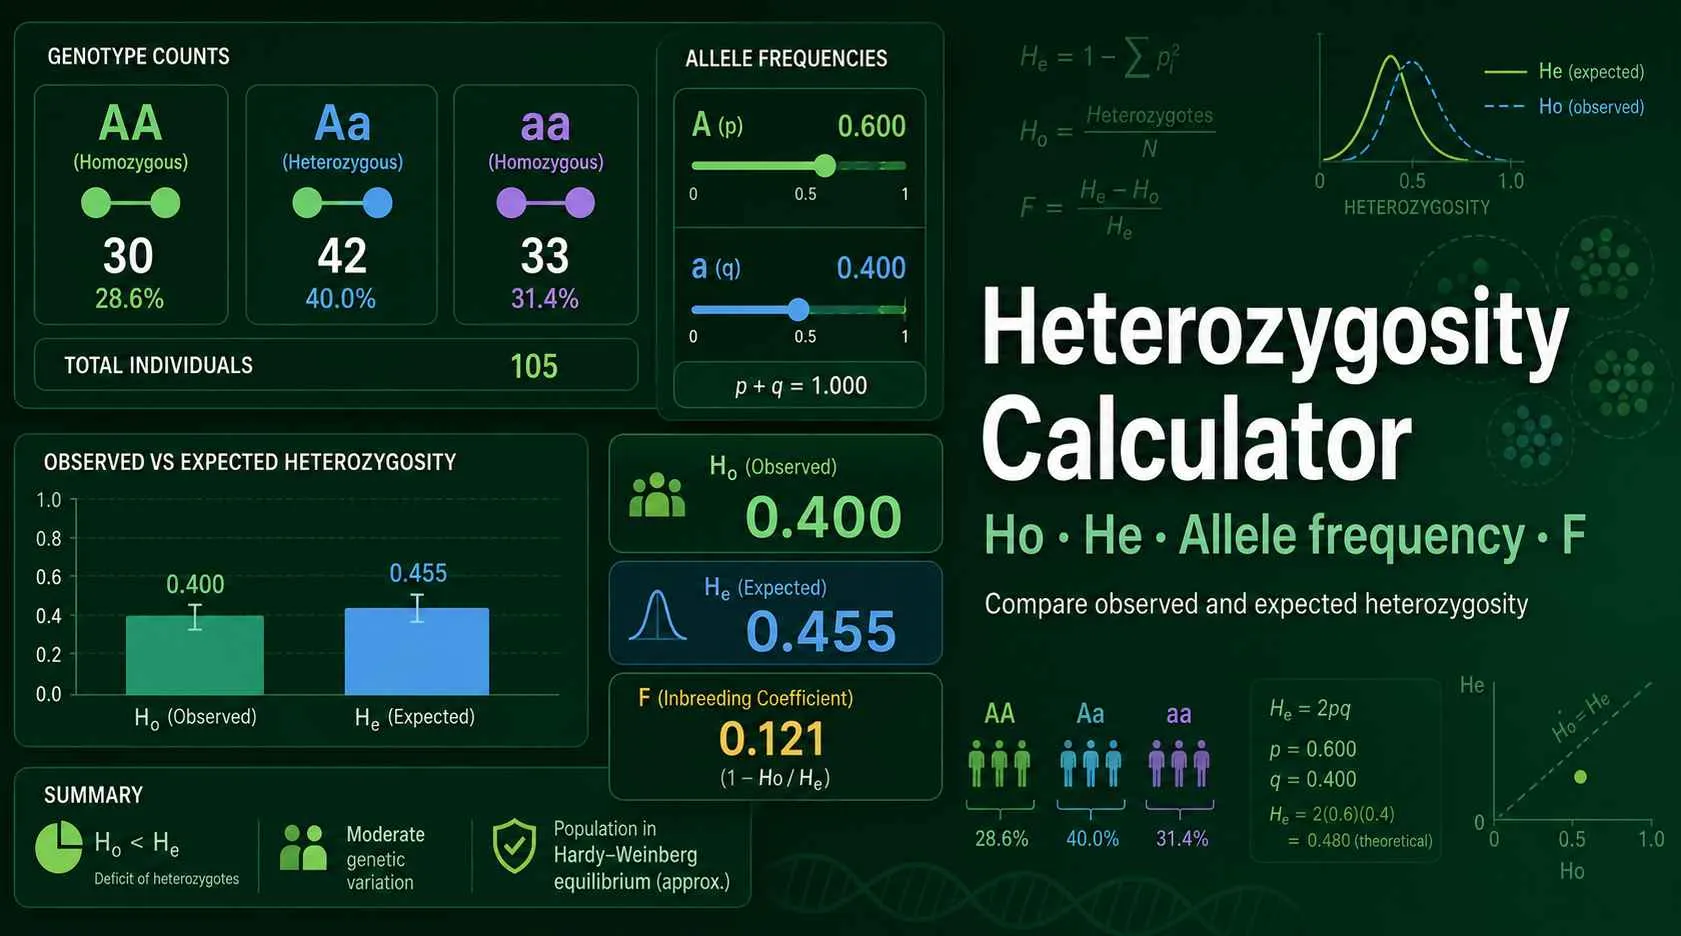
Population genetics diagram comparing observed heterozygosity, expected heterozygosity, allele frequencies, and inbreeding coefficient
Figure 1. Heterozygosity compares observed heterozygotes with allele-frequency expectations at a genetic locus. The diagram shows AA, Aa, and aa genotype classes, allele frequencies p and q, and the relationship between Ho, He, and Wright-style F.

What heterozygosity tells you

Heterozygosity answers a simple question: how often do individuals carry two different alleles at a locus? Observed heterozygosity, or Ho, uses the genotype counts you measured. Expected heterozygosity, or He, uses allele frequencies and asks what random mating predicts.

For a biallelic SNP, He reaches its maximum of 0.50 when both alleles have equal frequencies. Multi-allelic markers can reach higher values because many alleles can spread diversity across more genotype combinations. That makes microsatellite He useful in conservation genetics, forensic marker panels, and population-structure studies.

Use this page with the Allele Frequency Calculator when you need p and q first. Use the Genotype Frequency Calculator when your main question concerns AA, Aa, and aa proportions.
Heterozygosity formulas used by the tool

These formulas cover the common student and lab workflows. They separate the observed genotype result from the allele-frequency expectation.

Observed heterozygosity

Ho = heterozygotes / total individuals

Ho uses the genotype counts in your sample. For AA = 48, Aa = 42, and aa = 10, Ho equals 42 / 100 = 0.42.

Expected heterozygosity

He = 2pq or He = 1 − Σpᵢ²

Use 2pq for two alleles. Use 1 − Σpᵢ² for microsatellite or multi-allelic data. The value gives the probability that two random allele copies differ.

Inbreeding coefficient

F = 1 − Ho / He

F compares the observed heterozygote fraction with expectation. Positive F suggests a heterozygote deficit. Negative F suggests a heterozygote excess.

What each input and result means

AA, Aa, aa counts

Use these for SNPs and other two-allele diploid markers. The tool converts them into p, q, Ho, and He.

Allele-copy counts

Use these for multi-allelic loci. A diploid sample of 100 individuals contributes 200 allele copies.

Ho result

This value reports the observed fraction of heterozygous individuals in your sample.

He result

This value estimates gene diversity from allele frequencies. It does not require genotype counts in advanced mode.

F result

This value flags heterozygote deficit or excess by comparing Ho with He.

Effective alleles

This value converts diversity into the number of equally common alleles that would give the same He.

Worked examples for SNPs and microsatellites

SNP example: compare Ho and He

A class scores 100 individuals at one SNP. The counts are AA = 48, Aa = 42, and aa = 10. Allele A has frequency p = (2 × 48 + 42) / 200 = 0.69. Allele a has frequency q = 0.31.

Ho equals 42 / 100 = 0.42. He equals 2pq = 2 × 0.69 × 0.31 = 0.428. F equals 1 − 0.42 / 0.428 = 0.019. The sample sits close to the random-mating expectation.

Microsatellite example: use allele diversity

A marker has allele-copy counts A = 82, B = 54, C = 28, and D = 16. The total equals 180 copies. The allele frequencies equal 0.456, 0.300, 0.156, and 0.089.

He equals 1 − (0.456² + 0.300² + 0.156² + 0.089²) = 0.670. This locus carries more diversity than a typical biallelic SNP because four alleles contribute to heterozygote possibilities.

How to read Ho, He, and F values

Ho ≈ He

The observed heterozygote fraction matches the allele-frequency expectation. This often supports random-mating assumptions, but it does not prove equilibrium alone.

Ho < He

The sample has a heterozygote deficit. Common causes include inbreeding, Wahlund effect, null alleles, and population subdivision.

Ho > He

The sample has a heterozygote excess. This can appear from balancing selection, heterozygote advantage, family structure, or sampling noise.

Heterozygosity often feeds into population-structure metrics. If you compare populations, the FST Population Differentiation Calculator uses expected heterozygosity logic to measure genetic differentiation.

Why genetic diversity researchers use He

He summarizes allele diversity without listing every genotype. That makes it practical for SNP panels, microsatellites, STR loci, and conservation datasets. The National Institute of Justice explains that observed heterozygosity can be compared with expected heterozygosity to detect population dynamics in forensic population genetics. Read the NIJ heterozygosity overview.

Gene diversity also supports marker choice. A SNP with He near 0.50 separates individuals better than a rare-allele SNP with He near 0.05. A microsatellite with He above 0.80 can carry even more identity information, although genotyping errors and null alleles need careful checks.

Heterozygosity questions students ask

What does observed heterozygosity measure?

Observed heterozygosity, written as Ho, measures the fraction of sampled individuals that carry two different alleles at a locus. For a biallelic marker, Ho equals the Aa count divided by AA + Aa + aa. A sample with 42 heterozygotes among 100 individuals has Ho = 0.42. This number describes the data you actually observed, not the value expected under random mating.

How do I calculate expected heterozygosity?

Expected heterozygosity, written as He, uses allele frequencies. For two alleles, He = 2pq. For more than two alleles, He = 1 − Σpᵢ². The value estimates the probability that two allele copies drawn at random from the population carry different alleles.

What does F mean in this calculator?

F compares observed heterozygosity with expected heterozygosity. The calculator uses F = 1 − Ho/He. Positive F values show fewer heterozygotes than expected. Negative F values show more heterozygotes than expected, which can occur from sampling noise, balancing selection, or mixed family structure.

Why can Ho and He differ?

Ho and He differ when real genotype counts depart from random-mating expectations. Inbreeding, population subdivision, Wahlund effect, null alleles, assortative mating, selection, or genotyping errors can reduce heterozygotes. Small samples can also shift Ho away from He by chance. Treat the difference as a diagnostic clue, not a final explanation.

Can I use this tool for microsatellite loci?

Yes. Use Advanced mode for microsatellites or other multi-allelic markers. Enter each allele name and its allele-copy count. The calculator then uses He = 1 − Σpᵢ², which supports any number of alleles. You can also add observed heterozygote counts if you want F from Ho and He.

What is a high heterozygosity value?

A high value depends on the marker type. A biallelic SNP reaches its maximum He of 0.50 when p = q = 0.50. A multi-allelic microsatellite can exceed 0.80 when many alleles occur at similar frequencies. High He usually means the marker carries strong diversity information.

Does heterozygosity prove Hardy-Weinberg equilibrium?

No. Heterozygosity gives an important summary, but it does not prove equilibrium by itself. A formal Hardy-Weinberg test compares observed genotype counts with p², 2pq, and q² expectations. Use Ho, He, and F as a fast screening step before deeper equilibrium or population-structure analysis.