FST Population Differentiation Calculator

Calculate FST from allele counts and compare genetic differentiation between two populations. The calculator converts counts into allele frequencies, estimates expected heterozygosity within and across populations, and reports the loci that drive population structure.

Live FST population differentiation calculator

Add one or more biallelic loci, enter allele A counts for both populations, and read the multi-locus FST estimate instantly.

Choose an FST population differentiation example

Load a marker set, then edit allele counts to match your own two-population data.

Two populations share similar allele frequencies across several SNP markers.

Allele counts by population

Enter allele A counts and total allele copies. Diploid samples usually contribute two allele copies per individual.

Pop 1 A frequency

46.0%

Pop 2 A frequency

49.0%

Single-locus FST

0.0009

Pop 1 A frequency

63.0%

Pop 2 A frequency

59.0%

Single-locus FST

0.0017

Pop 1 A frequency

27.5%

Pop 2 A frequency

31.3%

Single-locus FST

0.0017

Live result

Low differentiation

The two populations show similar allele frequencies at these markers.

Multi-locus FST

0.0014

Mean p gap

3.6%

Allele frequency separation between two populationsPopulation 1Population 2allele-frequency gapFST = 0.001higher values mean stronger structure

Highest differentiating locus

SNP-3 contributes the strongest single-locus signal with FST 0.0017 and an allele-frequency gap of 3.7%.

FST by locus

Bars show which markers create the strongest allele-frequency separation.

SNP-10.0009
SNP-20.0017
SNP-30.0017

Detailed FST table

Locusp1p2Pooled pHTHSFST
SNP-10.4600.4900.4750.4990.4980.0009
SNP-20.6300.5900.6100.4760.4750.0017
SNP-30.2750.3130.2940.4150.4140.0017
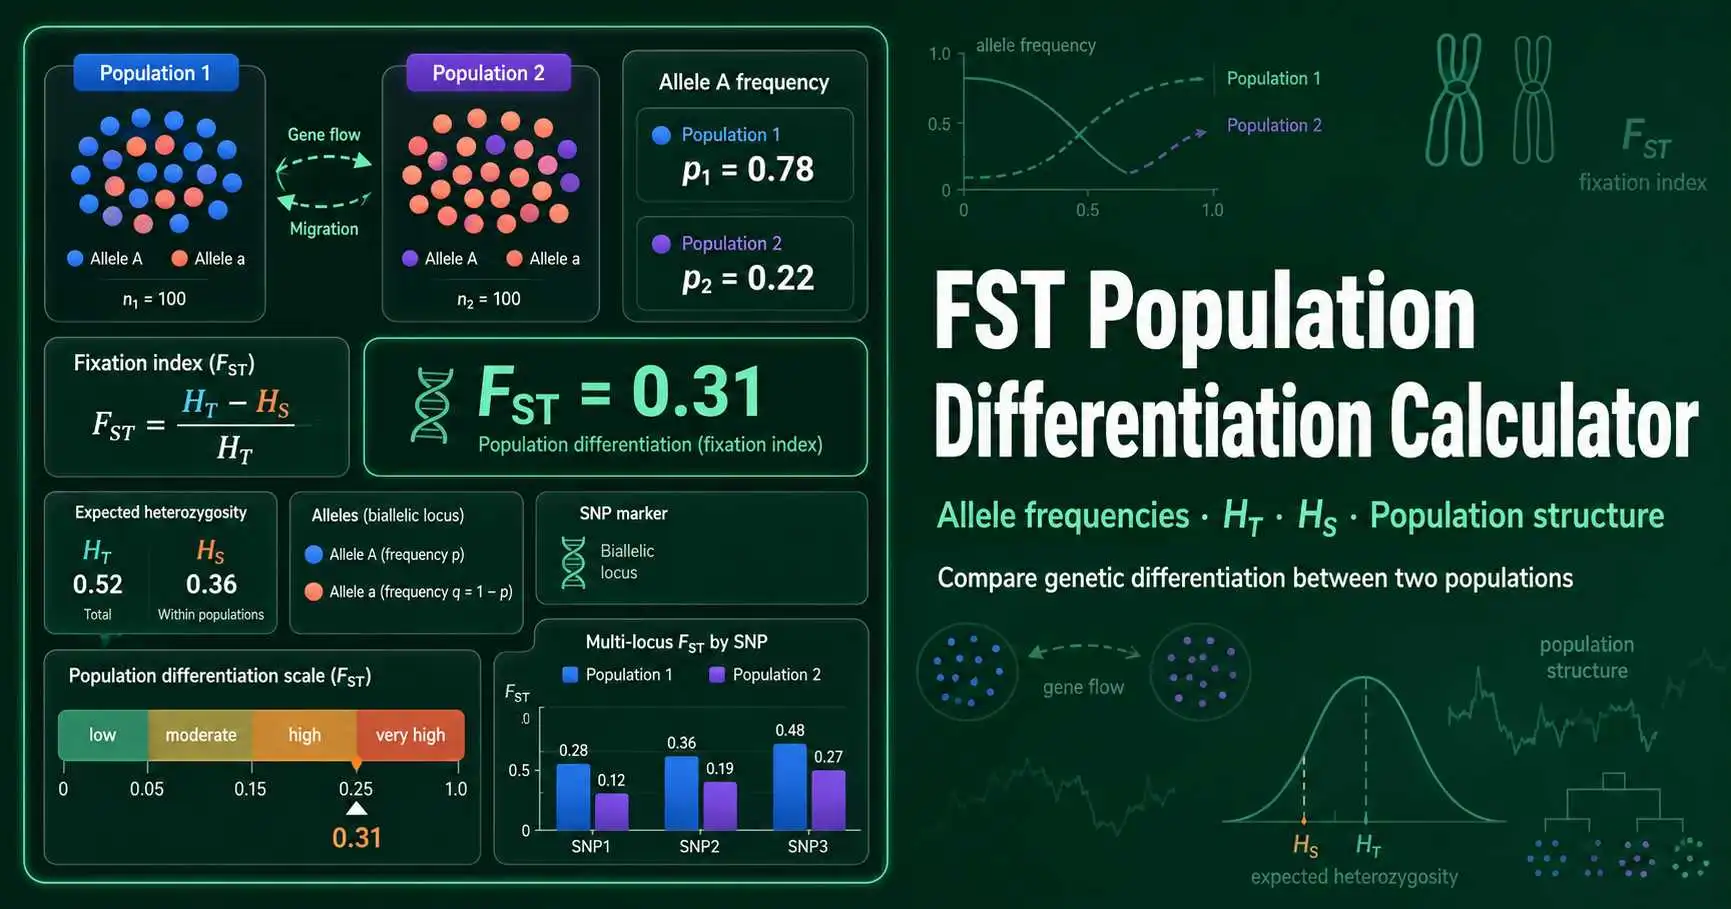
FST population differentiation diagram showing two populations, allele-frequency differences, heterozygosity components, and a multi-locus FST result
Figure 1. FST compares expected heterozygosity within subpopulations with total expected heterozygosity across the pooled sample. The diagram links allele-frequency differences, genetic drift, gene flow, and population structure in a two-population marker set.

What FST means in population genetics

FST is a fixation index that describes genetic differentiation among populations. Sewall Wright developed the F-statistics framework to measure how population subdivision changes genotype and allele-frequency patterns. In practical terms, FST asks how much total genetic diversity comes from allele-frequency differences between populations.

A value near 0 means the sampled populations carry similar allele frequencies. A value near 1 means the populations show strong separation at the markers tested. Holsinger and Weir describe FST as the proportion of genetic diversity due to allele-frequency differences among populations. Read their population-structure review.

This calculator uses a heterozygosity-based biallelic model. It works well for teaching SNP-like markers because every locus uses allele A frequency in population 1 and population 2. Researchers who analyze large sequencing panels often use software that adds confidence intervals, missing-data handling, and Weir-Cockerham estimators.
How to use FST Population Differentiation Calculator

  1. 1

    Enter allele A counts for population 1

    Type the number of allele A copies and the total allele copies sampled at each locus.

  2. 2

    Enter allele A counts for population 2

    Use the same allele definition for the second population so both frequencies describe the same variant.

  3. 3

    Review single-locus FST values

    Check which markers contribute the strongest allele-frequency separation between populations.

  4. 4

    Interpret the multi-locus FST result

    Use the combined estimate as a summary of population structure across the marker set.

Keep the allele definition consistent across rows. If allele A means the alternate SNP allele in population 1, it must mean the same alternate SNP allele in population 2.

What each part of FST Population Differentiation Calculator does

Example preset buttons

Presets load low, moderate, strong, or fixed allele-frequency differences. They help students see how FST changes when population structure strengthens.

Allele-count inputs

Each row accepts allele A count and total allele copies for two populations. The tool calculates p1, p2, pooled p, HT, and HS from those counts.

Live result banner

The banner reports the multi-locus estimate and a plain-language interpretation. It updates as soon as you edit any allele count.

Locus bars and table

The chart highlights the strongest differentiating markers. The table keeps the intermediate heterozygosity values visible for checking calculations.

FST formula used by this calculator

For each biallelic locus, the calculator estimates total expected heterozygosity and average within-population expected heterozygosity. It then calculates the fraction of total diversity that sits between populations.

FST = (HT − HS) / HT

HT = 2p̄(1 − p̄), HS = weighted mean of 2p(1 − p)

This formula connects directly with the random allele-frequency changes shown in the Genetic Drift Simulator. Small isolated populations can move apart quickly, especially when their effective population size stays low for many generations.

FST worked examples from allele counts

Example 1: similar populations

Population 1 has 48 allele A copies out of 100. Population 2 has 52 allele A copies out of 100. The frequencies equal 0.48 and 0.52, so the pooled frequency equals 0.50.

HT equals 0.50. HS sits close to 0.499. The resulting FSTstays near 0.002, which signals very low differentiation at this marker.

Example 2: separated populations

Population 1 has 90 allele A copies out of 100. Population 2 has 10 allele A copies out of 100. The allele-frequency gap equals 0.80, even though both populations have the same sample size.

HT equals 0.50 because the pooled frequency is 0.50. HS equals 0.18, so FST equals 0.64. Most marker diversity now comes from population separation.

How to interpret FST values without overclaiming

FST helps compare population structure, but it does not identify the cause by itself. Drift, selection, nonrandom mating, population bottlenecks, and migration barriers can all shift allele frequencies. Use the result as an evidence signal, then compare it with sampling history, geography, marker function, and population size.

0–0.05

Low differentiation

Allele frequencies look similar.

0.05–0.15

Moderate differentiation

Population structure appears measurable.

0.15–0.25

High differentiation

Markers show strong separation.

>0.25

Very high differentiation

Most diversity sits between populations.

FST calculator inputs and outputs

Allele A count

Number of sampled copies carrying the allele tracked at each locus.

Total allele copies

Usually twice the number of diploid individuals genotyped at an autosomal marker.

p1 and p2

Allele A frequencies in population 1 and population 2.

HT and HS

Expected heterozygosity across the pooled sample and within populations.

Multi-locus FST

Combined differentiation estimate across all entered loci.

When FST results can mislead

Marker choice changes the result. A few SNPs under selection can show stronger differentiation than neutral genome-wide markers. Rare alleles can also behave differently from common alleles because heterozygosity depends on p(1 − p).

Sampling design matters as much as the equation. Small sample sizes inflate uncertainty, while uneven sampling can make one population dominate the pooled allele frequency. If you want to check genotype expectations before comparing populations, use the Hardy-Weinberg Calculator first.

This calculator supports education and exploratory analysis. It does not replace population-genetic software for genome-wide datasets, bootstrapped confidence intervals, or publication-grade inference.

FST Population Differentiation Calculator FAQs

What does the FST Population Differentiation Calculator measure?

The FST Population Differentiation Calculator measures how much allele-frequency variation comes from differences between two populations. A value near 0 means the populations show similar allele frequencies at the markers you entered. A value near 1 means the populations share little allele-frequency variation at those loci. The result reflects the markers and samples you provide, not every locus in the genome.

How do I enter allele counts for an FST calculation?

Enter the count of allele A and the total allele copies sampled in each population. A diploid sample of 50 individuals usually contains 100 allele copies at an autosomal SNP. If population 1 has 62 A alleles out of 100 total copies, enter 62 and 100. Repeat the same pattern for population 2 and every marker.

What FST value counts as low or high differentiation?

Many teaching examples use rough bands: below 0.05 suggests low differentiation, 0.05 to 0.15 suggests moderate differentiation, 0.15 to 0.25 suggests high differentiation, and above 0.25 suggests very high differentiation. These bands work as classroom guides, not universal cutoffs. Species biology, marker type, sampling design, and geographic scale change how researchers interpret the same number.

Why can two populations have FST near zero?

FST approaches zero when allele frequencies look similar across populations. Gene flow, recent shared ancestry, large effective population size, or weak drift can keep allele frequencies close. If population 1 has allele A at 0.48 and population 2 has allele A at 0.51, the heterozygosity within populations stays close to total heterozygosity. That small difference produces a low FST.

Can I calculate FST from one SNP?

Yes, but one SNP gives a narrow view of population differentiation. A single marker can produce a high value because of selection, genotyping error, or random sampling. Multi-locus estimates usually provide a more stable signal because they average across many independent markers. This calculator reports both single-locus FST and a multi-locus heterozygosity-based estimate.

Does FST prove that natural selection caused differentiation?

No. FST measures allele-frequency separation, not the cause of that separation. Genetic drift, reduced migration, founder effects, bottlenecks, selection, and technical sampling bias can all raise FST. A high value can identify markers worth studying, but it does not prove adaptive divergence. Researchers usually combine FST with ecological data, genome scans, and replication across populations.

What is the difference between FST and allele-frequency difference?

Allele-frequency difference reports the direct gap between populations, such as 0.70 versus 0.30. FST scales that difference by total expected heterozygosity. This scaling matters because the same absolute gap can mean different things when an allele is rare, common, or near intermediate frequency. The calculator reports both values so you can see the raw gap and the standardized differentiation statistic.

Should I use FST with microsatellites, SNPs, or sequencing data?

FST can describe differentiation from SNPs, microsatellites, and sequence variants, but the estimator and interpretation can change. This calculator uses a teaching-friendly biallelic allele-count model, so it fits SNP-like markers best. Multiallelic microsatellite data usually need a method that handles more than two alleles per locus. Large sequencing studies often use dedicated software with confidence intervals and missing-data filters.

Use these tools to connect population differentiation with drift, effective population size, and allele-frequency change.