Punnett Square vs Pedigree Chart vs Probability
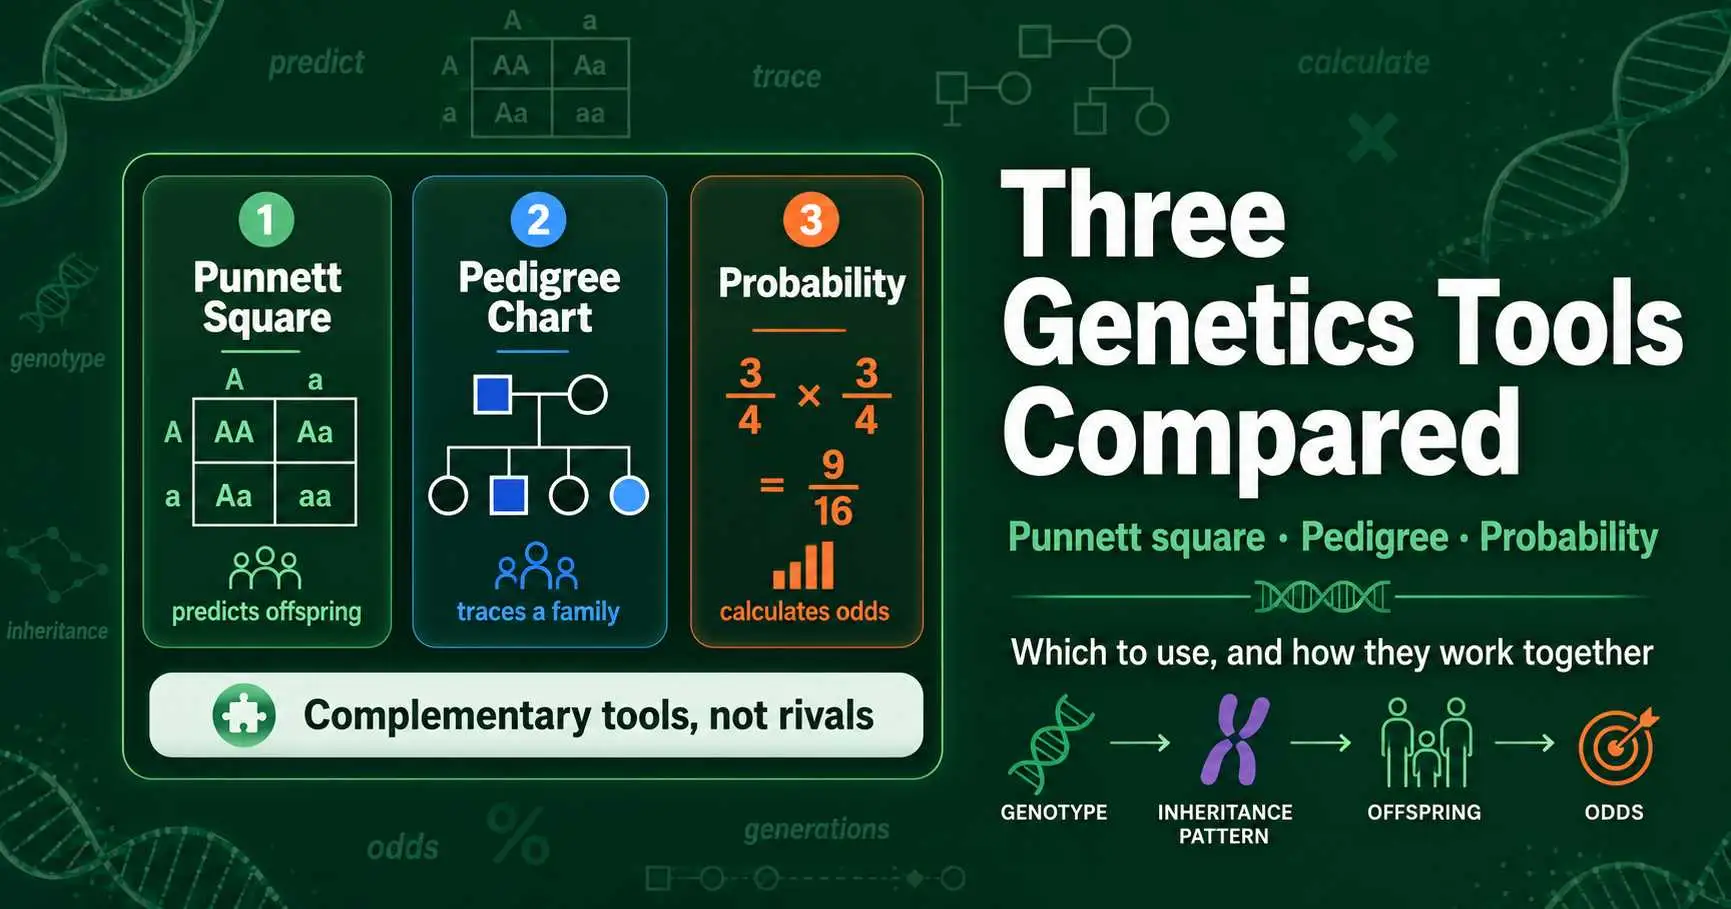
The three main tools in genetics each answer a different question. A Punnett square predicts the offspring of two parents whose genotypes you know. A pedigree chart traces a trait through a real family across generations to work out genotypes and inheritance patterns. The probability method calculates the odds of a specific outcome using multiplication, no diagram required. They are not rivals; they are complementary tools, and knowing which to reach for is a genetics skill in itself.
Students often treat these as interchangeable or get confused about which one a problem wants. This guide lays out exactly what each tool does, its strengths and limits, and the situations where it is the right choice. It also shows how the three work together, since real genetics problems frequently combine them. By the end you will be able to pick the right tool instantly and use them as a coordinated set. Each tool rests on the same Mendelian foundations, just applied to a different question.
The Three Tools at a Glance
Each tool has a distinct job, and seeing them side by side makes the differences clear before we dig into each one. The core distinction is direction: some tools look forward to predict offspring, while others look backward to deduce what already happened in a family.
A Punnett square is a grid that predicts the possible genotypes and phenotypes of offspring when you know both parents' genotypes. It looks forward, from parents to children, and shows all possible combinations visually. A pedigree chart is a family tree that records which individuals show a trait across several generations. It looks backward and across, using observed family members to deduce genotypes and identify the pattern of inheritance. The probability method is a calculation, not a diagram, that uses multiplication to find the chance of a specific outcome. It is the fastest route to a single answer and scales to any number of genes.
The relationship between them is the key insight. A pedigree often tells you the genotypes, which you then feed into a Punnett square or a probability calculation to predict the next generation. The Punnett square and probability method are two routes to the same predictions, one visual and one mathematical. Understanding that they occupy different points in a single workflow, from observing a family to predicting a child, is what turns three separate tools into one coherent approach.
A simple way to keep them straight is to think about what information you start with and what you want to end with. If you start with known parent genotypes and want all the possible children, you want a Punnett square. If you start with a family's observed traits and want to know the inheritance pattern or someone's hidden genotype, you want a pedigree. If you start with known probabilities and want the single odds of a particular result, you want the probability method. The starting point and the desired endpoint together point to the right tool almost every time, which is why naming them at the outset of a problem saves so much effort.
The Punnett Square: Predicting From Known Parents
The Punnett square is the tool most people learn first, and its job is to predict offspring when you already know the parents' genotypes. It is a grid that lays out every possible combination of the parents' gametes, showing all the genotypes their children could have and in what proportions.
Its great strength is visual clarity. Because every possible offspring genotype appears in its own box, you can see the full range of outcomes at a glance and read off both genotype and phenotype ratios. This makes it ideal for learning, since it shows why a ratio comes out the way it does rather than just giving a number. For a single gene it uses a simple 2x2 grid, and for two genes a 4x4 grid, both manageable by hand. It is the natural choice whenever you want to see the complete picture of a cross.
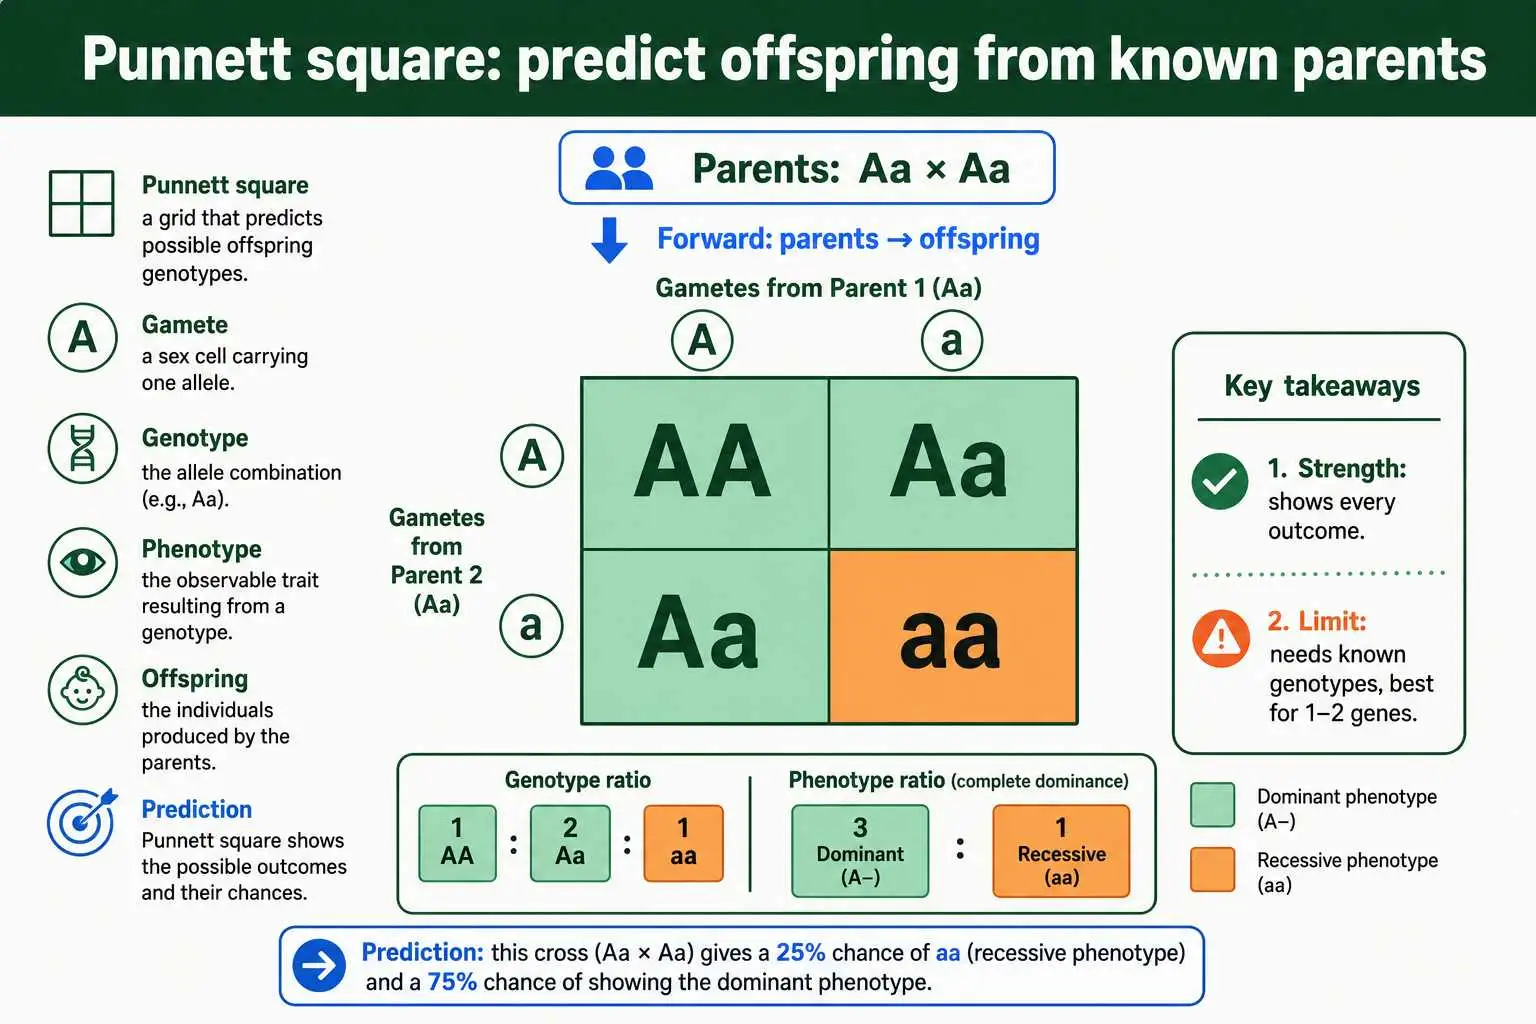
The Punnett square has clear limits, though. It requires you to know the parents' genotypes to start, so it cannot help when those are unknown. It also becomes unwieldy fast as you add genes, since a three-gene cross needs a 64-box grid and more genes quickly become impractical. And it predicts only forward, from parents to offspring, so it cannot trace a trait back through a family. Within its range, one or two genes with known parents, the Punnett square is the clearest tool available, which is exactly why it anchors most genetics teaching.
The Pedigree Chart: Tracing Traits Through Families
The pedigree chart serves a completely different purpose: instead of predicting offspring, it traces a trait through the real generations of a family to reveal how it is inherited. It is a diagram of a family tree with symbols marking who shows the trait and who does not.
The conventions are standard. Circles represent females and squares represent males, with shaded shapes indicating individuals who have the trait and unshaded shapes those who do not. Horizontal lines connect mating partners, and vertical lines link parents to their children, with each generation on its own row. By reading the pattern of shaded and unshaded shapes across generations, you can work backward to deduce individuals' genotypes and, crucially, identify whether the trait is dominant, recessive, or sex-linked.
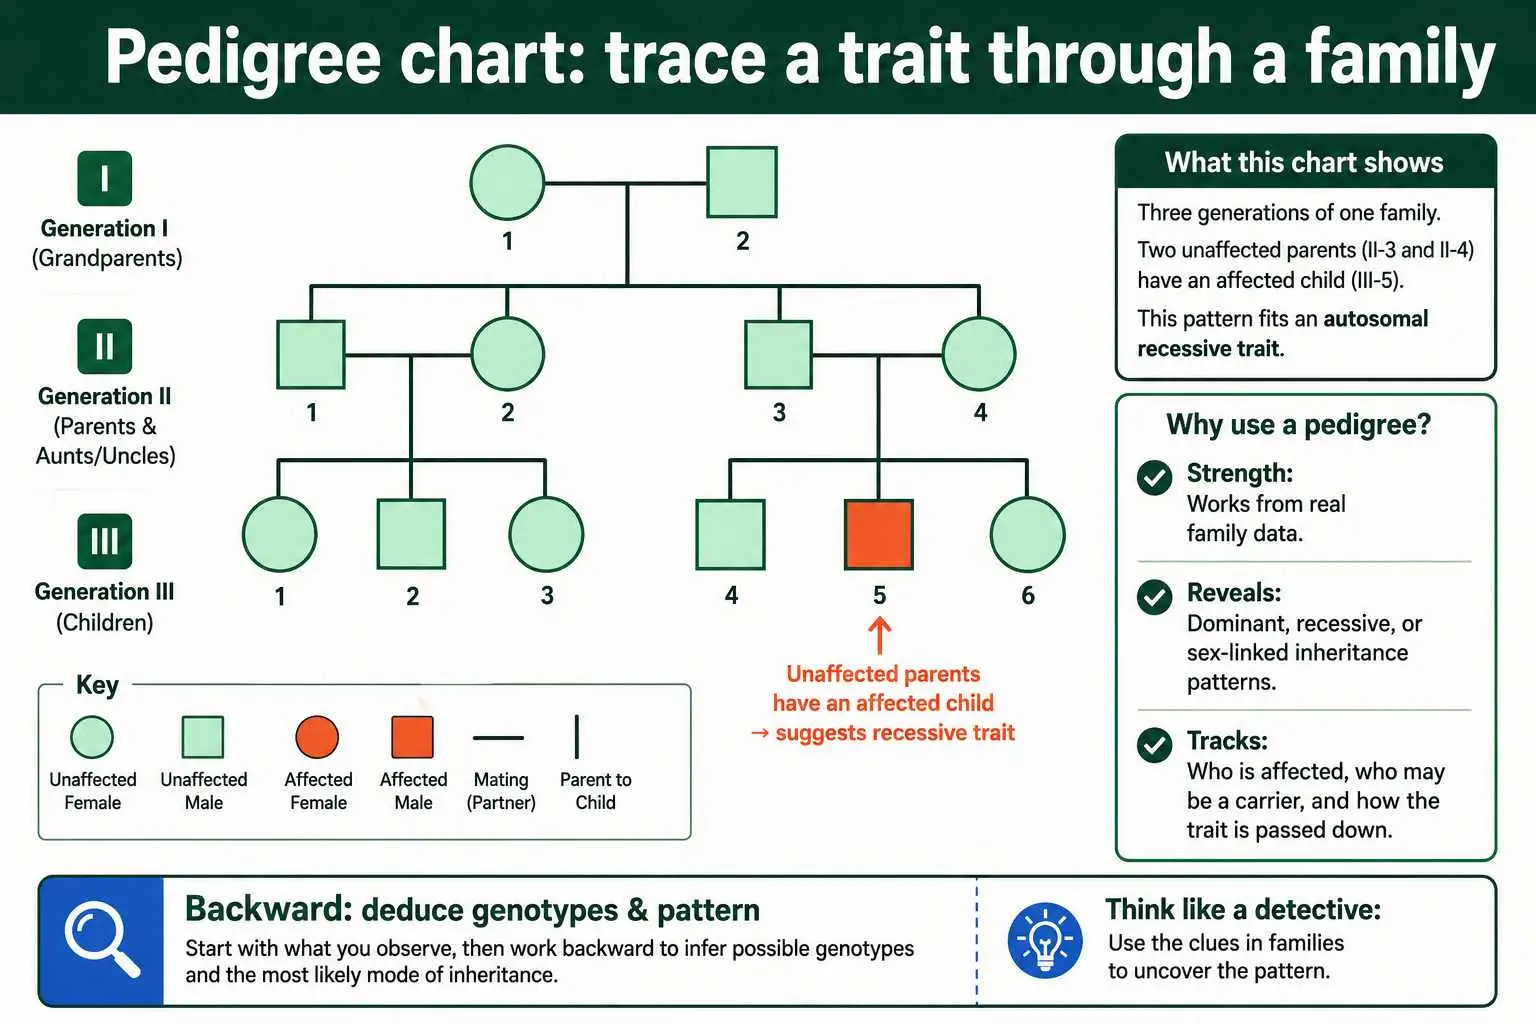
This backward-looking, observational nature is the pedigree's defining strength. It works with real family data rather than hypothetical crosses, which is why genetic counselors rely on it. The telltale patterns are diagnostic: a recessive trait can skip generations and appear in children of unaffected parents, a dominant trait appears in every generation, and a sex-linked recessive trait affects far more males than females. The pedigree's limit is that on its own it describes what has happened rather than predicting precise odds for a future child. For that, you take the genotypes it reveals and hand them to a Punnett square or a probability calculation, which is why a pedigree analyzer and a cross calculator complement each other so well.
The Probability Method: Calculating the Odds
The probability method drops the diagrams entirely and uses pure calculation to find the chance of a specific outcome. It rests on the multiplication rule: because genes assort independently, the probability of a combination of traits is the product of the probabilities of each trait separately.
Its defining strength is speed and scalability. Where a Punnett square needs a 64-box grid for three genes, the probability method finds the chance of any specific three-gene outcome in a single line of multiplication. To find the chance of an offspring being recessive for three traits from heterozygous parents, you simply multiply 1/4 by 1/4 by 1/4 to get 1/64, with no grid at all. This makes it the only practical tool for crosses involving many genes, and the fastest tool even for simpler ones when you want a single specific probability rather than the whole picture.
The probability method is exactly how the forked-line method works under the hood, and it is the engine behind most genetics calculators. Its tradeoff is that it gives a number rather than a visual, so it is less useful for seeing the full range of outcomes or for learning why a ratio arises. It also still requires knowing the relevant genotypes or probabilities to start, just like the Punnett square. But when you need the odds of one particular combination, especially across several genes, multiplication beats drawing every time. A phenotype probability calculator applies this method to return the odds for any specified outcome. As genetics study guides such as Fiveable note, Punnett squares and probability are simply two representations of the same underlying Mendelian probabilities.
Side-by-Side Comparison
Lining up the three tools across the questions that matter most shows clearly when each is the right choice. None is universally best; each wins for a particular kind of problem.
| Feature | Punnett square | Pedigree chart | Probability method |
|---|---|---|---|
| Main purpose | Predict offspring | Trace family inheritance | Calculate specific odds |
| Direction | Forward (parents to offspring) | Backward (across generations) | Forward |
| Needs known genotypes? | Yes | No, deduces them | Yes |
| Best for number of genes | 1 to 2 | Any (one trait usually) | Many |
| Output | Visual grid, all outcomes | Family diagram, pattern | A single probability |
| Greatest strength | Clarity, shows everything | Works from real data | Speed, scales easily |
The pattern is straightforward. Choose a Punnett square when you know the parents and want to see all the offspring possibilities clearly, especially for one or two genes. Choose a pedigree chart when you have a family history and need to figure out the inheritance pattern or someone's genotype. Choose the probability method when you want the odds of one specific outcome quickly, or when there are too many genes for a grid. Matching the tool to the question is the real skill, and it saves enormous effort compared to forcing every problem through the same method. A student who reaches for a Punnett square on a many-gene probability question, or tries to predict from a pedigree without first deducing the genotypes, makes the work far harder than it needs to be.
How the Three Tools Work Together
The most important thing to understand is that these tools are designed to be used together, not in isolation. A complete genetics problem often flows through all three, each handling the part it does best. Seeing this workflow is what ties the whole topic together.
A typical sequence starts with a pedigree. Suppose a family is concerned about a recessive condition.
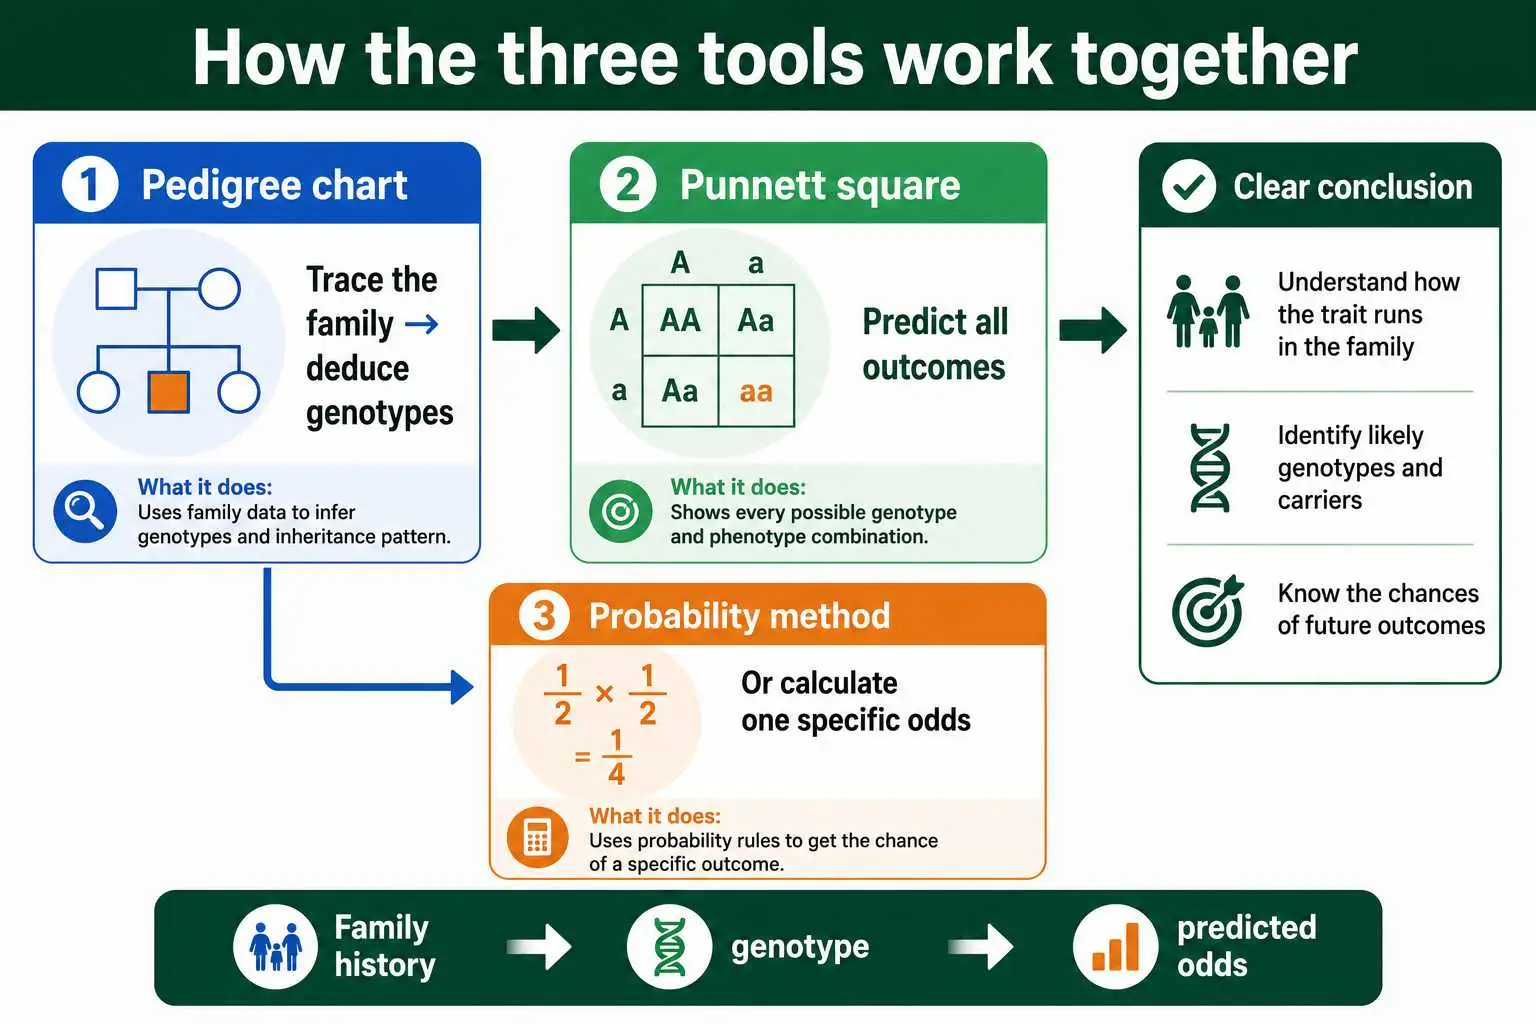
You first use the pedigree to trace the trait through past generations, which reveals the inheritance pattern and lets you deduce the genotypes of the parents who are planning a child. With those genotypes in hand, the pedigree has done its job. Next, you take the parents' deduced genotypes and build a Punnett square, or run a probability calculation, to predict the chance their child inherits the condition. The pedigree supplied the genotypes; the Punnett square or probability method turns them into a prediction.
This handoff is why the tools feel complementary rather than competing once you understand them. The pedigree answers "what is the pattern and what are the genotypes," the Punnett square answers "what are all the possible outcomes," and the probability method answers "what is the chance of this specific outcome." A genetic counselor might use all three in a single consultation. Recognizing where each fits in the flow, from family history to genotype to predicted odds, transforms them from three things to memorize into one connected method for reasoning about inheritance.
Choosing the Right Tool: A Decision Guide
With the three tools clear, picking the right one for any problem comes down to a few quick questions. Running through them takes seconds and points you straight to the best approach.
First ask: do I know the parents' genotypes? If not, and you have family information, start with a pedigree to deduce them. If you do know the genotypes, you are ready to predict. Then ask: do I want to see all the outcomes or just one specific probability? If you want the full picture of a cross and the genes number one or two, draw a Punnett square. If you want the odds of a single combination, or there are several genes involved, use the probability method instead. These two questions resolve the vast majority of choices.
A few extra cues help in tricky cases. If a problem shows a family tree with shaded symbols, it is a pedigree problem, even if it later asks you to predict a child. If a question asks for a probability across three or more traits, reach for multiplication, since a grid would be enormous. If it asks for a complete genotype and phenotype ratio for one or two genes, the Punnett square is ideal. And remember that many problems deliberately chain the tools, so the answer may involve reading a pedigree first and then calculating. Treating the choice as a quick decision rather than a guess is what makes you efficient, and it is the habit that distinguishes confident genetics work.
A Fourth Tool: The Test Cross
Worth mentioning alongside the main three is the test cross, a specialized technique that answers one specific question: is an organism showing a dominant trait homozygous or heterozygous? Since both genotypes look identical, you cannot tell by appearance alone, and this is where the test cross comes in.
The method is simple. You cross the individual of unknown genotype with one that is homozygous recessive. Because the recessive parent can only contribute recessive alleles, the offspring directly reveal what the unknown parent carried. If any offspring show the recessive trait, the unknown parent must have carried a recessive allele and is therefore heterozygous. If all offspring show the dominant trait, the unknown parent is most likely homozygous dominant. The recessive parent acts as a kind of genetic developer, exposing the hidden allele.
The test cross fits neatly into the family of tools because it is really a targeted use of the Punnett square combined with observed results. You set up the cross, predict the outcomes for each possible parent genotype, then compare with the actual offspring to deduce the answer. In that sense it bridges prediction and observation, much as a pedigree does, but for a single organism rather than a family. When a problem asks you to determine an unknown dominant genotype, the test cross is the right tool, and a test cross calculator models exactly this kind of cross. The principle reappears in plant and animal breeding, where breeders routinely test-cross a prized dominant individual to confirm it breeds true before relying on it, showing once more how these classroom tools carry directly into real practice.
A Worked Walkthrough: Using All Three Together
To see the tools as a coordinated set, follow a single realistic scenario through all three. Imagine a couple wondering about the chance their child will have a recessive condition that runs in one partner's family.
Step one uses the pedigree. By charting the family, you observe that the condition appeared in a sibling of one partner whose own parents were unaffected. That pattern, unaffected parents with an affected child, tells you the condition is recessive and that both of those grandparents were carriers. From this you can deduce that the partner in question has a known chance of being a carrier, and testing or further pedigree detail can pin the genotypes down. The pedigree has converted a family history into concrete genotype information.
Step two switches to prediction. Suppose the analysis establishes that both prospective parents are carriers, each heterozygous. Now you build a Punnett square for the cross of two carriers, which lays out the familiar result: one unaffected, two carriers, one affected, a 25 percent chance the child has the condition. If you only wanted that single probability and not the full breakdown, step two could instead be a one-line probability calculation: 1/2 from each parent multiplied together gives 1/4. Either route reaches the same answer, with the Punnett square showing the whole picture and the probability method giving the number directly. This is the workflow in miniature: the pedigree found the genotypes, and a predictive tool turned them into the odds the couple wanted, each tool doing precisely the part it does best.
Frequently Asked Questions
What is the difference between a Punnett square and a pedigree chart?
A Punnett square predicts the offspring of two parents whose genotypes you know, looking forward from parents to children. A pedigree chart traces a trait through a real family across generations, looking backward to deduce genotypes and identify the inheritance pattern.
When should I use the probability method instead of a Punnett square?
Use the probability method when you want the odds of one specific outcome, or when a cross involves three or more genes that would make a Punnett square impractical. It uses multiplication to give a single answer quickly, without drawing a grid.
Can you use a pedigree and a Punnett square together?
Yes, and they are often used together. You use the pedigree to deduce the parents' genotypes from family history, then build a Punnett square or run a probability calculation with those genotypes to predict the chance for a future child.
Which method is best for many genes at once?
The probability method. A Punnett square for three genes needs 64 boxes and grows impractical beyond that, while multiplication handles any number of genes by multiplying the separate probabilities together in a single calculation.
Pick the Tool, Solve the Problem
The Punnett square, pedigree chart, and probability method are three complementary tools, each suited to a different question. The Punnett square predicts offspring from known parents and shows every outcome visually, working best for one or two genes. The pedigree chart traces a trait through a real family to deduce genotypes and reveal the inheritance pattern. The probability method calculates the odds of a specific outcome with multiplication, scaling effortlessly to many genes. None replaces the others; each is the right choice for its own kind of problem.
The real skill is matching the tool to the question, and recognizing that hard problems often chain all three: read the pedigree, deduce the genotypes, then predict with a square or a calculation. With that workflow in mind, genetics problems become a matter of choosing the right tool rather than forcing one approach everywhere. You can handle the predictive steps for any cross with the Punnett Square Calculator, which builds the grid and the probabilities so you can focus on the reasoning. For a clear academic treatment of how pedigrees and Punnett squares fit together, this resource from Biology LibreTexts is a useful place to read further.