AP Biology Punnett Squares & the Chi-Square Test
AP Biology takes Punnett squares one crucial step further than most introductory courses: you not only predict offspring ratios but also test whether real data fit those predictions, using the chi-square goodness-of-fit test. A Punnett square gives you the expected ratio, such as 3:1 or 9:3:3:1, and the chi-square test tells you whether your observed counts are close enough to that expectation to support your genetic hypothesis. Mastering both is essential, because the chi-square test appears frequently on the AP exam.
This guide is written for AP Biology students who need to go beyond basic crosses into statistical analysis. It covers how Punnett squares set up the expected ratios, how to run a chi-square test step by step, how to find degrees of freedom and critical values, and how to state a conclusion the way AP graders want. Worked problems tie it all together. If you need the Punnett square fundamentals first, our guide on how a Punnett square works covers the basics this builds on.
What AP Biology Adds Beyond Basic Genetics
At the AP level, genetics shifts from simply predicting ratios to reasoning statistically about data. You are still expected to be fluent with Punnett squares, genotype versus phenotype, and the expected Mendelian ratios, but the AP course layers statistical analysis on top. The central new skill is using the chi-square test to compare observed experimental results directly against the ratios a Punnett square predicts.
This reflects how real genetics works. When you cross two organisms, the offspring rarely match the predicted ratio exactly, because chance affects which gametes combine. A predicted 3:1 ratio might show up as 78 dominant and 22 recessive rather than a perfect 75 to 25. The question AP Biology asks is whether that deviation is small enough to be explained by chance, or large enough to suggest your genetic hypothesis is wrong. The chi-square test answers exactly that question with a number.
The shift is one of emphasis rather than entirely new content. Students arriving from earlier courses already understand Mendelian ratios; the AP focus is on deeper statistical reasoning and on explaining what the results mean biologically. A complete AP answer does not stop at calculating a statistic. It translates that number back into a biological conclusion, such as whether the data are consistent with independent assortment. Keeping that translation in mind is the difference between a partial answer and full credit, and it is the habit this guide reinforces throughout.
Punnett Squares Set Up the Expected Ratios
Before any statistics, the Punnett square does essential work: it generates the expected ratio that the chi-square test will compare against. This is why solid Punnett square skills remain the foundation of AP genetics, even though the spotlight moves to the statistical test.
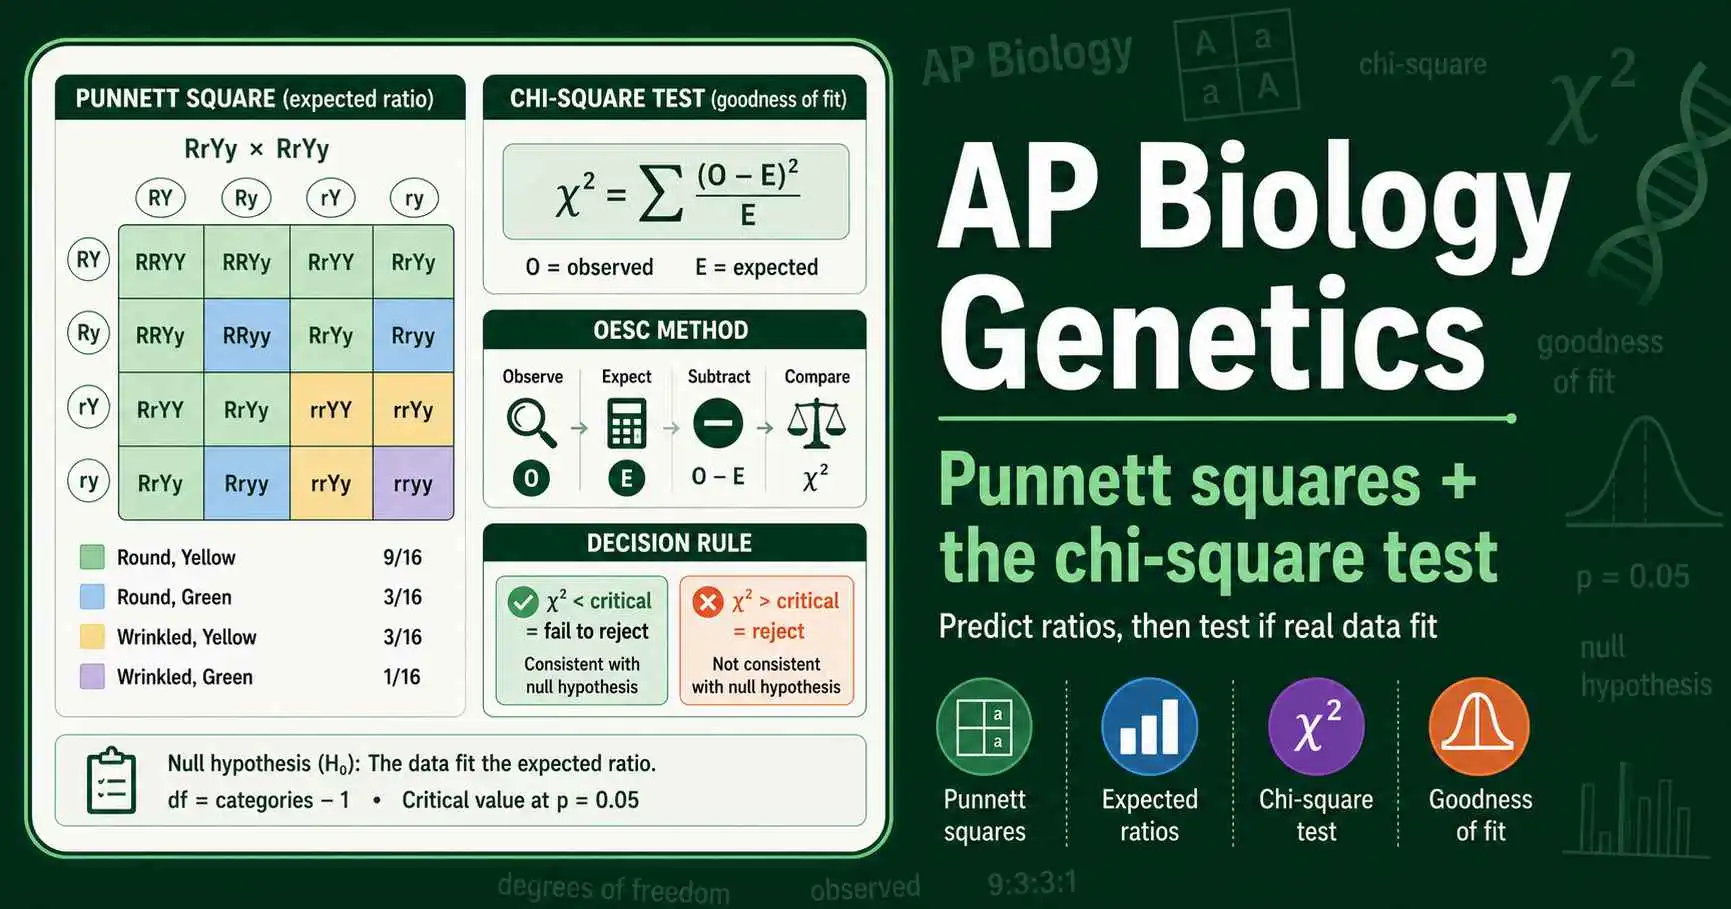
For a monohybrid cross of two heterozygotes, the Punnett square predicts a 3:1 phenotypic ratio. For a dihybrid cross of two double-heterozygotes, it predicts the 9:3:3:1 ratio, the cornerstone of testing independent assortment. These expected ratios are the null hypothesis of your chi-square test, the prediction you are checking your data against. Without the correct expected ratio from the Punnett square, the entire statistical analysis falls apart, so getting the cross right comes first.
The expected ratio then becomes expected counts. If you predict a 3:1 ratio and you have 100 offspring, you expect 75 dominant and 25 recessive. If you predict 9:3:3:1 and have 160 offspring, you expect 90, 30, 30, and 10 in the four classes. These expected numbers, derived straight from the Punnett square, are what you plug into the chi-square formula alongside your observed counts. For dihybrid expected ratios in particular, our guide to the dihybrid cross and the 9:3:3:1 ratio shows exactly how the prediction arises.
The Chi-Square Goodness-of-Fit Test
The chi-square goodness-of-fit test measures how well observed data match an expected ratio, producing a single number that captures the total deviation. The formula is chi-square equals the sum of observed minus expected, squared, divided by expected, calculated for each category and then added together.
In symbols, that is the sum of (O − E)² / E across all phenotype classes. A handy memory aid that AP teachers use is OESC: Observe, Expect, Subtract, Compare. You record the Observed counts, calculate the Expected counts from your Punnett square ratio, Subtract and square the difference over expected for each category, and finally Compare your total to a critical value. Following OESC means you never miss a step on the exam.
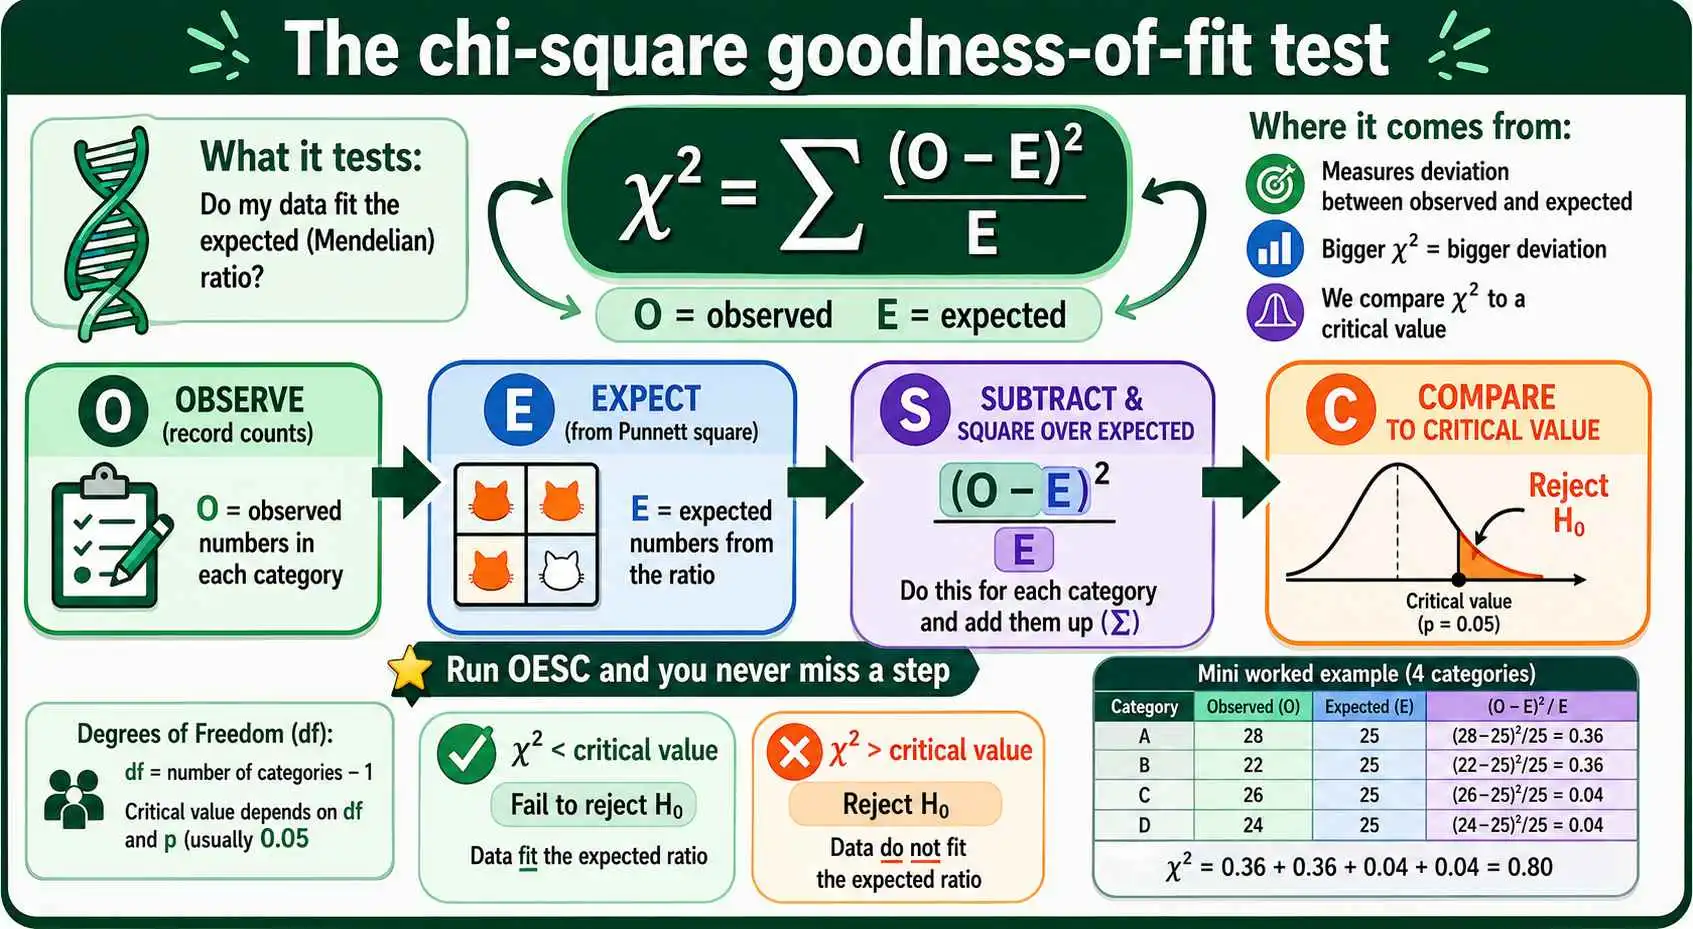
The logic behind the number is intuitive once you see it. A larger chi-square value means a bigger gap between what you observed and what you expected. A small value means your data closely match the prediction. The test works by squaring each deviation so positive and negative differences do not cancel out, and by dividing by the expected count so the same absolute deviation matters more when the expected number is small. The result is a single statistic summarizing the total mismatch, which you then judge against a threshold. To run the arithmetic quickly while you check your work, a chi-square calculator computes the statistic from your observed and expected values.
Degrees of Freedom and Critical Values
Two more pieces turn your chi-square number into a decision: degrees of freedom and the critical value. Getting these right is essential, because they determine the threshold your statistic must clear to be significant.
Degrees of freedom equals the number of phenotype categories minus one. For a monohybrid cross with two phenotypes, dominant and recessive, degrees of freedom is 2 minus 1, which equals 1. For a dihybrid cross with four phenotype classes, it is 4 minus 1, which equals 3. This number tells you which row to read on the chi-square distribution table. A common AP mistake is using the number of offspring instead of the number of categories, so always count phenotype classes, not individuals.
The critical value comes from the chi-square table at the standard significance level of p equals 0.05, which AP Biology uses by convention. At 1 degree of freedom, the critical value is 3.84. At 3 degrees of freedom, it is 7.81. The p equals 0.05 threshold means there is only a 5 percent probability that a deviation as large as yours, or larger, would occur by chance alone if your hypothesis were correct. Knowing these two common critical values, 3.84 for one degree of freedom and 7.81 for three, covers the most frequent AP cross scenarios and lets you interpret your result with confidence.
Making the Decision: Reject or Fail to Reject
The final step is comparing your calculated chi-square to the critical value and stating a conclusion in the language statisticians and AP graders expect. This is where many students lose points, not on the math, but on the interpretation.
The rule is straightforward. If your chi-square value is less than the critical value, you fail to reject the null hypothesis, meaning the deviation between observed and expected is small enough to be due to chance, and your data are consistent with the predicted ratio. If your chi-square value is greater than or equal to the critical value, you reject the null hypothesis, meaning the deviation is too large to be explained by chance, and your data significantly differ from the prediction. Note the precise wording: you fail to reject, rather than accept, the null hypothesis, a distinction AP graders look for.
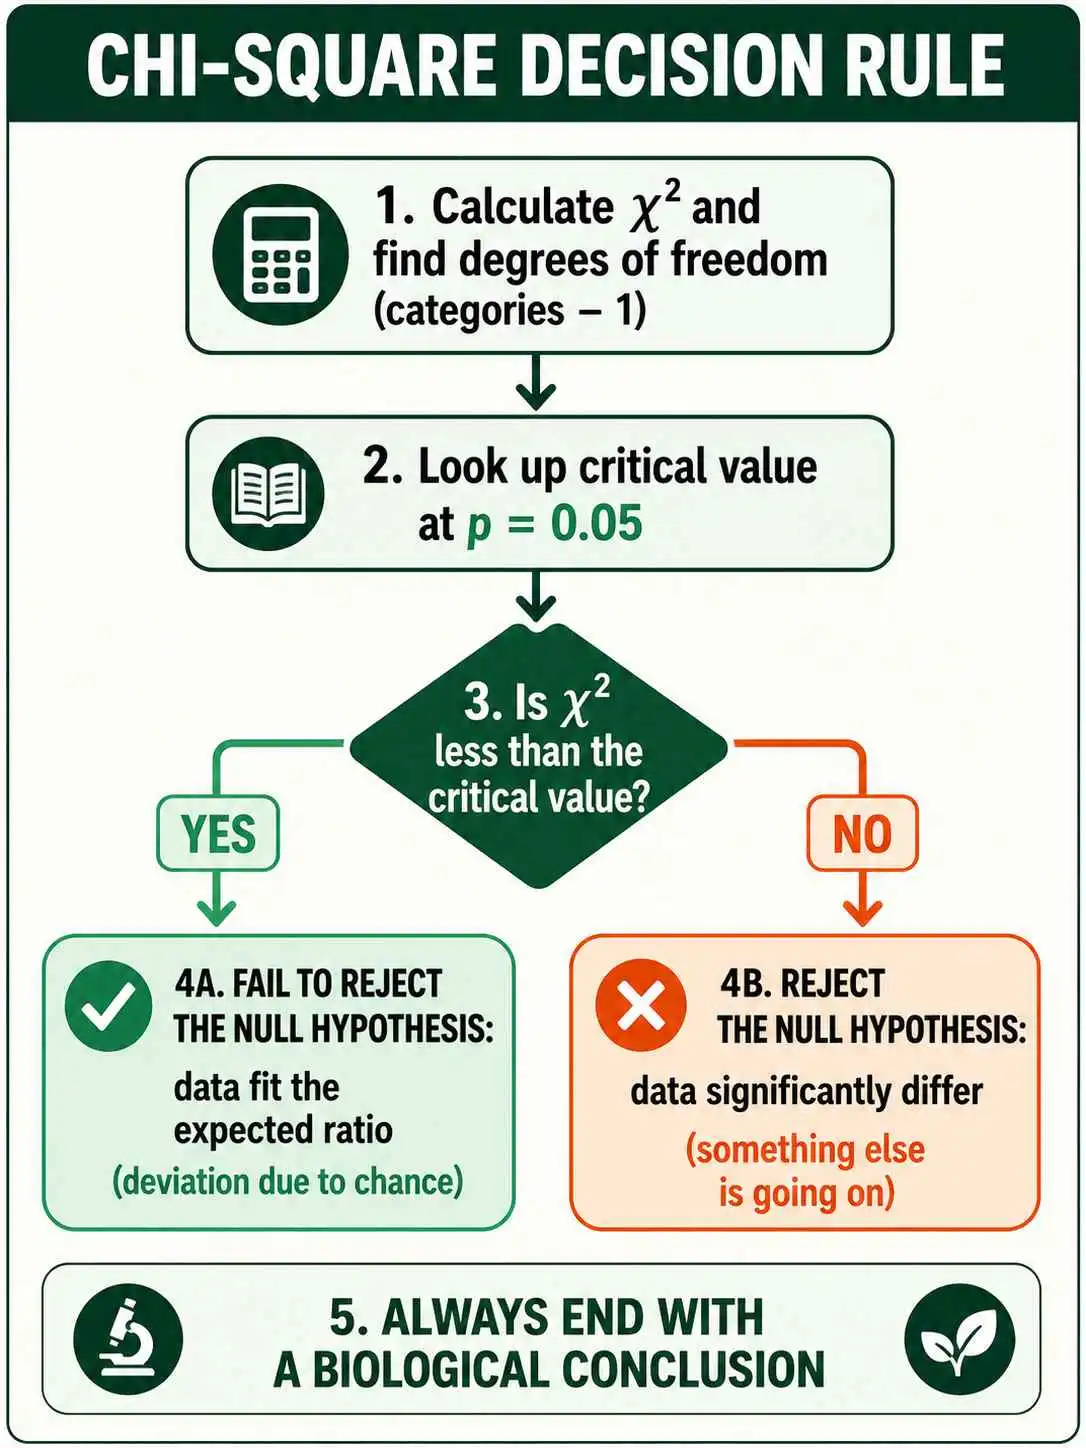
The biological interpretation matters as much as the statistical one. Failing to reject the null hypothesis for a 9:3:3:1 ratio means your data are consistent with the two genes assorting independently, supporting Mendel's law of independent assortment. Rejecting it suggests something else is going on, perhaps the genes are linked, or another factor is influencing the results. A full-credit AP answer always ends by connecting the statistical decision back to the biology, explaining what the result reveals about inheritance rather than stopping at a number. This translation from statistics to biology is the skill the AP exam most wants to see.
Worked Problem: A Monohybrid Chi-Square Test
Let us work a complete example the way you would on the exam. Suppose you cross two heterozygous pea plants (Aa × Aa) and expect a 3:1 ratio of tall to short. You observe 78 tall plants and 22 short plants, for 100 total. Does this fit the expected ratio?
Run OESC. The observed values are 78 tall and 22 short. The expected values, from the 3:1 ratio applied to 100 plants, are 75 tall and 25 short. Now compute each category: for tall, (78 − 75)² / 75 equals 9 / 75, which is 0.12. For short, (22 − 25)² / 25 equals 9 / 25, which is 0.36. Adding them gives a chi-square of 0.48. Degrees of freedom is 2 categories minus 1, which equals 1, so the critical value at p equals 0.05 is 3.84.
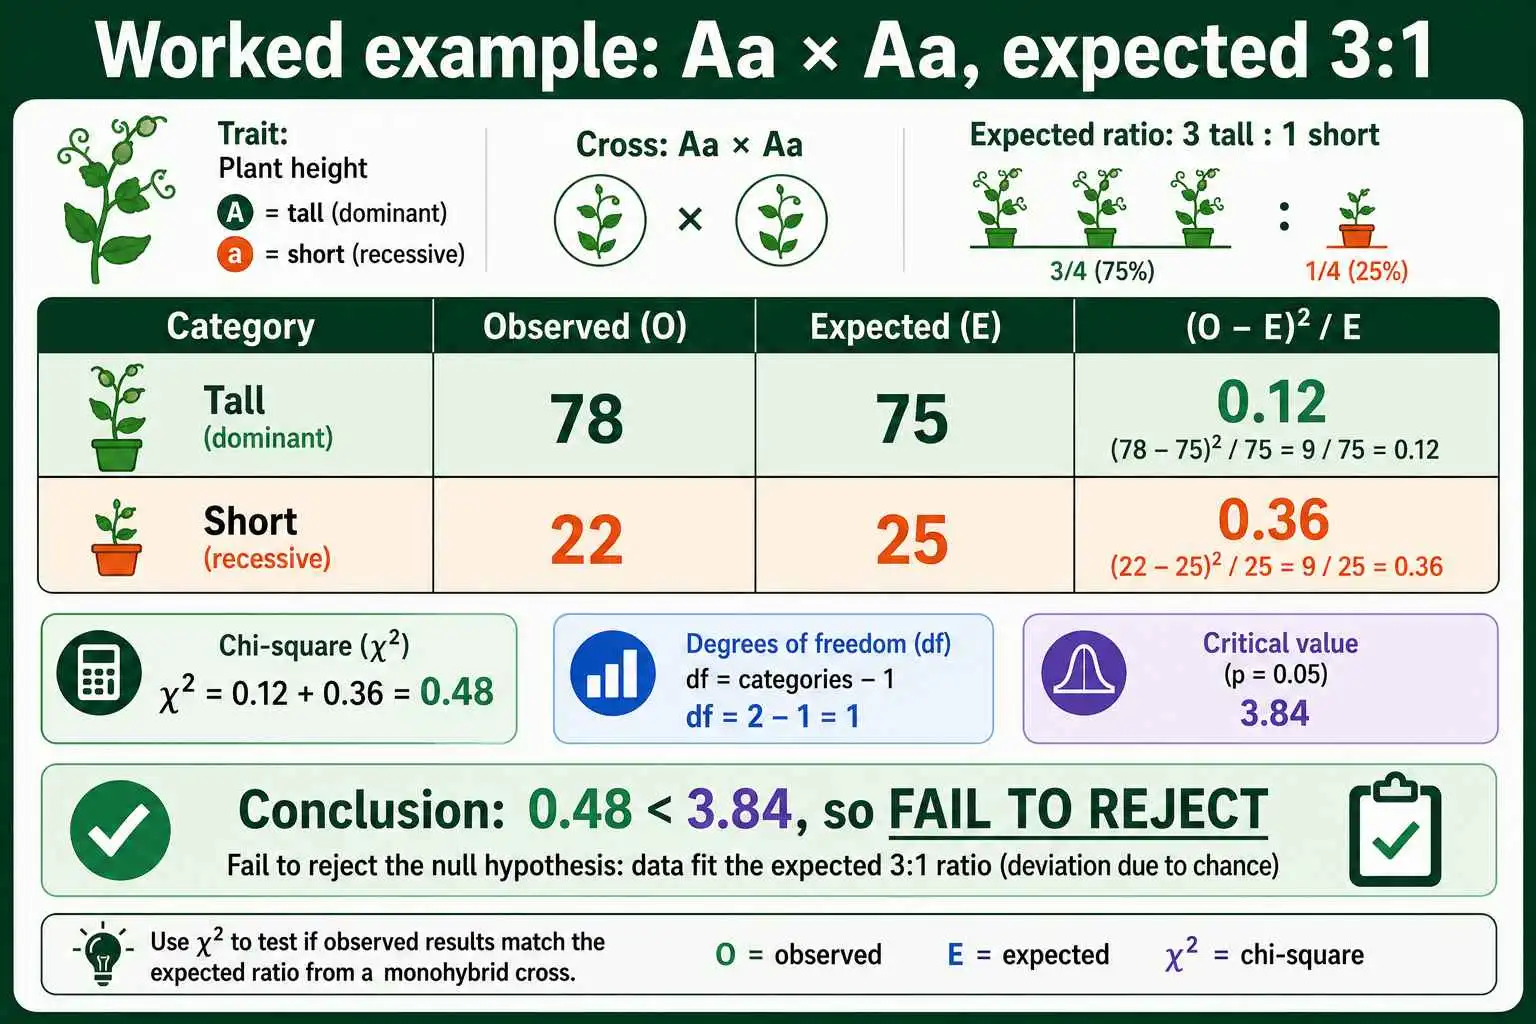
Now compare and conclude. Your chi-square of 0.48 is far less than the critical value of 3.84, so you fail to reject the null hypothesis. In plain language, the deviation between your observed 78:22 and the expected 75:25 is small enough to be due to chance, so your data are consistent with the predicted 3:1 ratio and with simple dominant-recessive inheritance. Notice the structure of the answer: the math, the comparison, and then the biological conclusion. That three-part structure is what earns full marks on an AP free-response question.
Worked Problem: A Dihybrid Chi-Square Test
Dihybrid problems test independent assortment, and they appear often on the AP exam. Suppose a dihybrid cross predicts a 9:3:3:1 ratio across four phenotype classes, and from 160 offspring you observe 91, 32, 28, and 9 in the four classes. Do these data support independent assortment?
First find the expected counts from the 9:3:3:1 ratio applied to 160 offspring. The ratio parts sum to 16, so one part is 160 divided by 16, which is 10. That gives expected values of 90, 30, 30, and 10. Now apply the formula to each class: (91 − 90)² / 90 is about 0.011, (32 − 30)² / 30 is about 0.133, (28 − 30)² / 30 is about 0.133, and (9 − 10)² / 10 is 0.1. Summing these gives a chi-square of roughly 0.38. Degrees of freedom is 4 categories minus 1, which equals 3, so the critical value at p equals 0.05 is 7.81.
Comparing, your chi-square of 0.38 is far below 7.81, so you fail to reject the null hypothesis. Biologically, this means the observed numbers are consistent with the expected 9:3:3:1 ratio, supporting the conclusion that the two genes assort independently, just as Mendel's second law predicts. Had the chi-square exceeded 7.81, you would reject the null hypothesis and suspect the genes might be linked or otherwise not assorting freely. This is precisely the kind of reasoning the AP exam rewards: using statistics to draw a genuine genetic conclusion. The same approach works for any expected ratio, whether it is the 3:1 of a monohybrid cross, the 9:3:3:1 of a dihybrid, or a modified ratio from gene interactions, so once you can run the test on these two cases you can apply it anywhere.
Beyond the Basics: Linkage and Other AP Topics
AP Biology genetics extends past simple crosses into topics where the chi-square test becomes a tool for discovery rather than just confirmation. Understanding these connections rounds out your preparation and shows why the statistics matter.
The most important is gene linkage. When two genes sit close together on the same chromosome, they do not assort independently, so a dihybrid cross deviates from the expected 9:3:3:1 ratio. A chi-square test that rejects the null hypothesis is often the first clue that genes are linked, since the data significantly differ from the independent-assortment prediction. This turns the chi-square test into a detective tool: a significant result does not just say "the prediction failed," it points toward a biological explanation worth investigating. AP questions sometimes frame linkage exactly this way, giving you data that fail the chi-square test and asking what it implies.
Other AP genetics topics also build on Punnett square foundations. Sex-linked inheritance, multiple alleles like the ABO blood system, and non-Mendelian patterns such as codominance and incomplete dominance all appear, and each can generate expected ratios that a chi-square test can check. The unifying theme is that the Punnett square predicts, real data deviate, and the chi-square test decides whether the deviation is meaningful. Mastering that cycle prepares you for nearly any AP genetics question, from a simple monohybrid cross to a linkage analysis. The Nature Scitable resource offers a deeper treatment of the statistics behind these tests.
How to Read a Chi-Square Distribution Table
The chi-square table can look intimidating, but reading it is simple once you know the two coordinates you need: degrees of freedom and significance level. Every AP genetics chi-square problem comes down to finding one cell in this table.
The table is organized with degrees of freedom running down the left side as rows, and significance levels, or p-values, running across the top as columns. To find your critical value, locate your degrees of freedom in the left column, then read across to the column for p equals 0.05, which is the standard AP threshold. The number where that row and column meet is your critical value. For 1 degree of freedom at p equals 0.05, you land on 3.84. For 3 degrees of freedom, you land on 7.81. That single number is the threshold your calculated chi-square must clear to be significant.
Understanding what the p-value column means deepens your interpretation. A lower p-value, such as 0.01 instead of 0.05, sets a more stringent standard, requiring a larger deviation before you reject the null hypothesis. AP Biology standardizes on p equals 0.05, which represents a 5 percent chance of wrongly rejecting a true hypothesis, so you can almost always use that column on the exam. Knowing how the table is laid out means you never have to memorize critical values blindly; you can find the right one for any number of categories. Still, memorizing the two most common values, 3.84 and 7.81, saves time under exam pressure, since monohybrid and dihybrid crosses cover most questions.
Common Chi-Square Mistakes on the AP Exam
A handful of errors cost AP students points on chi-square questions, and every one of them is avoidable. Knowing them in advance is the fastest way to protect your score on this high-value topic.
The most frequent mistake is calculating degrees of freedom from the number of offspring rather than the number of phenotype categories. Degrees of freedom is always categories minus one, so a dihybrid cross has 3 degrees of freedom regardless of whether you counted 100 or 1,000 offspring. A second common error is forgetting to derive expected counts from the Punnett square ratio, instead comparing observed numbers to each other or to a wrong ratio. Always translate the predicted ratio into expected counts that sum to your total sample size before applying the formula.
Two more errors involve the conclusion rather than the math. Students often write "accept the null hypothesis" when the correct phrasing is "fail to reject" it, a wording distinction AP graders enforce. And many students stop at the statistical decision without giving a biological interpretation, leaving marks on the table. A full answer states the chi-square value, the degrees of freedom, the critical value, the decision, and then what that decision means for the genetics. Finally, watch your arithmetic in the (O − E)² / E step, since a squaring or division slip there changes the whole result. Slowing down and following OESC in order prevents nearly all of these mistakes.
Frequently Asked Questions
What is the chi-square test used for in AP Biology?
The chi-square goodness-of-fit test compares observed experimental results against the ratio a Punnett square predicts. It tells you whether the deviation between observed and expected counts is small enough to be due to chance, or large enough to reject your genetic hypothesis.
How do you calculate degrees of freedom for a genetics chi-square test?
Degrees of freedom equals the number of phenotype categories minus one. A monohybrid cross with two phenotypes has 1 degree of freedom, and a dihybrid cross with four phenotype classes has 3 degrees of freedom. Count categories, not individual offspring.
What does it mean to reject the null hypothesis?
If your chi-square value exceeds the critical value, you reject the null hypothesis, meaning the deviation between observed and expected is too large to be explained by chance. The data significantly differ from the predicted ratio, suggesting another factor is at work.
What are the common chi-square critical values for AP Biology?
At p equals 0.05, the critical value is 3.84 for 1 degree of freedom (a monohybrid cross) and 7.81 for 3 degrees of freedom (a dihybrid cross). If your calculated chi-square is below the critical value, you fail to reject the null hypothesis.
Exam Day Strategy
AP Biology genetics rewards two linked skills: predicting ratios with Punnett squares and testing real data against them with the chi-square goodness-of-fit test. Start from the correct expected ratio, run the OESC workflow to compute your chi-square, find degrees of freedom as categories minus one, and compare to the critical value at p equals 0.05, using 3.84 for one degree of freedom and 7.81 for three. Then state your decision as reject or fail to reject the null hypothesis.
The detail that separates strong AP answers is always translating the statistic back into biology, explaining what the result says about inheritance or independent assortment. Practise the arithmetic until it is automatic, and finish every answer with a clear biological conclusion. You can confirm any expected ratio and check your statistic with the Punnett Square Calculator as you work through practice problems. For more worked chi-square examples aligned to AP, the Biology LibreTexts chapter is a reliable reference to read further.