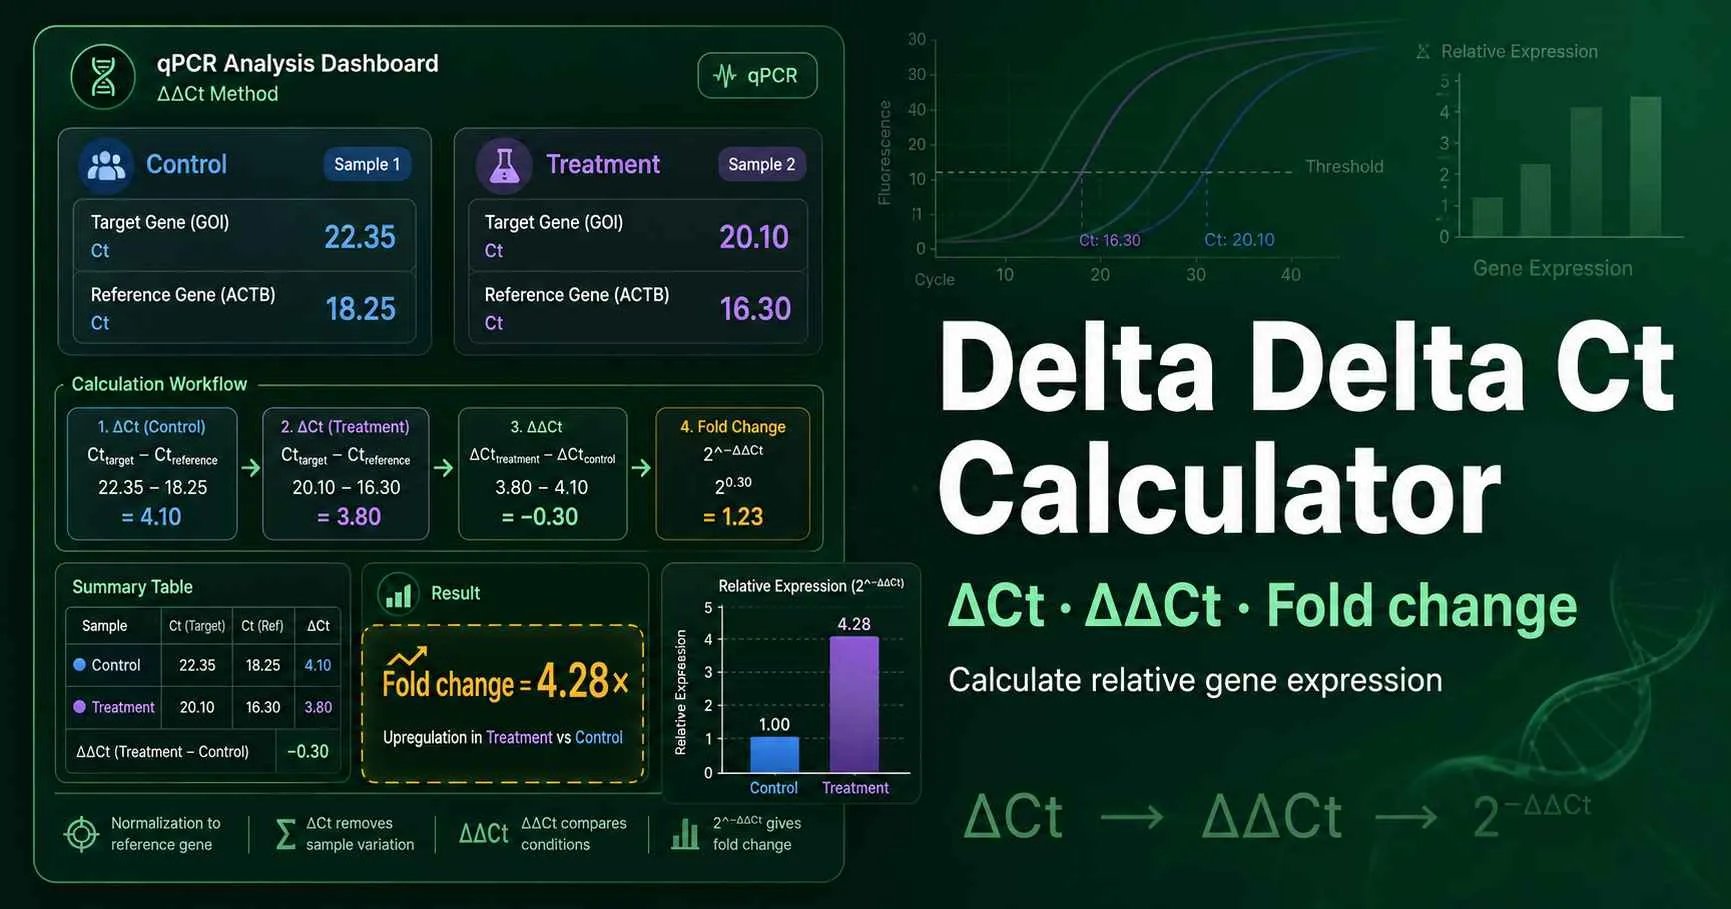
Delta Delta Ct Calculator for qPCR Fold Change

Calculate relative gene expression from qPCR Ct values with the ΔΔCt method. Enter a target gene, a reference gene, a control calibrator, and a test sample to get ΔCt, ΔΔCt, fold change, log2 fold change, and efficiency-corrected results.

Delta Delta Ct Calculator with Basic and Advanced qPCR modes

Basic mode handles one control and one sample. Advanced mode handles biological replicates, target-assay efficiency, reference-assay efficiency, and CSV export for your qPCR worksheet.

Delta Delta Ct Calculator mode

Use Basic mode for one control and one sample. Use Advanced mode for biological replicates and efficiency correction.

Gene labels and efficiency settings

Name the target gene and reference gene so exported results match your qPCR worksheet.

Live qPCR fold-change result

The result updates after every Ct, Cq, efficiency, or replicate change.

Target expression increased

Fold change

4.000×

ΔΔCt

-2.000

log2 FC

2.000

The sample contains more normalized target transcript than the control calibrator.

Percent change versus control: 300.0%.

Basic Ct inputs

Enter the Cq or Ct value for the target gene and the endogenous reference gene.

Basic calculation steps

Control ΔCt: IL6GAPDH = 5.300

Sample ΔCt: IL6GAPDH = 3.300

ΔΔCt: sample ΔCt − control ΔCt = -2.000

Formula: 2^-ΔΔCt = 4.000×

Visual fold-change summary

Delta Delta Ct log2 fold change scaleDownUpExpression direction4.00×

ΔCt comparison chart

Delta Ct comparison between control and sampleMean ΔCt comparisonControlSample5.303.30

Quality checks before interpretation

Assay efficiency

Target factor: 2.000. Reference factor: 2.000.

Replicate spread

Largest ΔCt SD: 0.115. Values above 0.5 need a closer look.

Formula used

Standard 2^-ΔΔCt method.

Delta Delta Ct qPCR fold change diagram showing target gene Ct, reference gene Ct, control sample, treated sample, ΔCt, ΔΔCt, and fold change
Figure 1. The ΔΔCt workflow normalizes a target transcript such as IL6 against a reference transcript such as GAPDH, then compares the normalized signal with a control calibrator. This layout shows how target Ct, reference Ct, ΔCt, ΔΔCt, and 2-ΔΔCt connect in RT-qPCR gene-expression analysis.

Delta Delta Ct method: what the calculator measures

The Delta Delta Ct method answers one question: how much did a target gene change after normalization to a reference gene? The method uses a control sample as the calibrator. It converts Ct differences into relative expression because each PCR cycle represents a change in starting template quantity.

The workflow uses three named entities in every valid comparison. The target gene is the transcript you study. The reference gene is the endogenous control used for normalization. The calibrator is the control sample that defines 1× expression.

Livak and Schmittgen described the 2-ΔΔCt method as a convenient approach for analyzing relative changes in real-time quantitative PCR experiments. Their paper also explains the assumptions behind the method and common variations for qPCR data analysis. Read the original 2^-ΔΔCt method paper.

Delta Delta Ct Calculator components and what each input does

Each input connects to a specific qPCR decision. Use this table when you are not sure which Ct value belongs in which field.

Target gene Ct

Ct or Cq for the gene you want to measure, such as IL6, TP53, MYC, or TNF.

Reference gene Ct

Ct for the internal control transcript, such as GAPDH, ACTB, HPRT1, or RPLP0.

Control calibrator

The baseline group that defines 1× expression, often untreated cells or wild type tissue.

Sample group

The test condition, treatment group, mutant, time point, or experimental sample.

Assay efficiency

The amplification efficiency for target and reference assays. Use 100% when validated efficiencies match.

Replicate table

Advanced mode area for biological replicates and replicate-level ΔCt variation.

Delta Delta Ct formula for 2^-ΔΔCt fold change

ΔCt normalizes each sample

ΔCt = Ct(target) − Ct(reference)

This step compares the target transcript with the endogenous control in the same sample.

ΔΔCt compares groups

ΔΔCt = ΔCt(sample) − ΔCt(control)

This step compares the normalized sample with the control calibrator.

Fold change reports expression

Fold change = 2^-ΔΔCt

This formula assumes both assays amplify with similar efficiency near two-fold per cycle.

Delta Delta Ct result interpretation table

Fold-change values confuse many users because down-regulation uses values below 1. Use this table when you write results or figure captions.

ΔΔCt = 0

No normalized expression change.

ΔΔCt = -1

The target increased two-fold in the sample.

ΔΔCt = -2

The target increased four-fold in the sample.

ΔΔCt = +2

0.25×

The target dropped to one quarter of control expression.

Delta Delta Ct examples for qPCR gene-expression analysis

Example 1: treatment increases IL6 expression

A researcher measures IL6 as the target gene and GAPDH as the reference gene. The control Ct values are 25.2 for IL6 and 19.9 for GAPDH, so control ΔCt equals 5.3. The treated sample Ct values are 23.1 and 19.8, so sample ΔCt equals 3.3.

ΔΔCt equals 3.3 − 5.3 = -2.0. The fold change equals 22, or 4.0×. The treated sample has four times more normalized IL6 transcript than the untreated calibrator.

Example 2: efficiency correction changes the fold value

A target assay amplifies at 93%, so its amplification factor equals 1.93. The reference assay amplifies at 101%, so its factor equals 2.01. The control and sample Ct shifts look similar to a standard ΔΔCt experiment, but the two assays do not amplify exactly alike.

Advanced mode uses the target factor and reference factor instead of assuming 2.00 for both assays. This matters when a primer pair performs slightly below the usual 90% to 110% screening range, or when target and reference efficiencies differ enough to bias the standard 2-ΔΔCt estimate.

How to use Delta Delta Ct Calculator for RT-qPCR data

  1. 1

    Enter target and reference Ct values

    Type the Ct or Cq values for the target gene and the endogenous reference gene in the control and sample groups.

  2. 2

    Choose Basic or Advanced mode

    Use Basic mode for one comparison, or use Advanced mode when you have biological replicates and efficiency-corrected qPCR data.

  3. 3

    Review ΔCt and ΔΔCt

    Check the normalized ΔCt values before interpreting the final fold change, because a reference gene shift can distort the result.

  4. 4

    Interpret fold change and log2 fold change

    Use fold change for plain-language reporting and log2 fold change when you need symmetric up-regulation and down-regulation values.

qPCR fold-change checks before you trust a ΔΔCt result

A useful ΔΔCt result starts with matched target and reference measurements from the same cDNA sample. Do not pair a target Ct from one replicate with a reference Ct from another replicate. That mistake changes ΔCt and can create a false expression shift.

Reference-gene stability matters as much as target-gene signal. GAPDH, ACTB, HPRT1, and RPLP0 can work in some systems, but no reference gene works in every tissue, treatment, or developmental stage. Check reference stability before you treat normalized expression as biological evidence.

Assay efficiency should support the math. Use the qPCR Efficiency Calculator when you have standard-curve slope values. Use the PCR Master Mix Calculator when setup consistency affects Ct variation. Use the DNA Copy Number Calculator when your qPCR workflow also needs absolute standards.

Delta Delta Ct Calculator FAQs

What does a Delta Delta Ct Calculator calculate?

A Delta Delta Ct Calculator calculates relative gene expression from qPCR Ct or Cq values. It first subtracts the reference gene Ct from the target gene Ct to get ΔCt. It then subtracts the control ΔCt from the sample ΔCt to get ΔΔCt. The standard fold change equals 2^-ΔΔCt when both assays amplify near 100% efficiency.

When should I use the 2^-ΔΔCt method?

Use the 2^-ΔΔCt method when you compare a target gene between a sample and a control calibrator. The method works best when the target assay and reference assay have similar amplification efficiencies. Common reference genes include GAPDH, ACTB, HPRT1, RPLP0, and 18S rRNA, but you should validate stability for your tissue and treatment. The result reports fold change relative to the control, not absolute copy number.

What is the difference between ΔCt and ΔΔCt?

ΔCt normalizes one sample by subtracting the reference gene Ct from the target gene Ct. ΔΔCt compares two normalized samples by subtracting the control ΔCt from the treated or test-sample ΔCt. A negative ΔΔCt produces a fold increase because 2^-ΔΔCt becomes greater than 1. A positive ΔΔCt produces a fold decrease because the fold value drops below 1.

How do I interpret a fold change below 1?

A fold change below 1 means the target transcript decreased in the sample relative to the control. For example, 0.25× means the normalized target signal is one quarter of the control level. Many writers report that as a 75% decrease or as a -2 log2 fold change. Report the direction clearly so readers do not confuse 0.25× with a four-fold increase.

Can I enter biological replicates in this calculator?

Yes. Advanced mode lets you enter control and sample replicates with target Ct and reference Ct values. The calculator computes ΔCt for each replicate, then uses group means for ΔΔCt and fold change. It also reports ΔCt standard deviation so you can spot noisy replicate groups. Large spread can indicate pipetting error, poor RNA quality, primer issues, or unstable reference gene expression.

Why does qPCR efficiency matter for ΔΔCt analysis?

The standard 2^-ΔΔCt formula assumes each assay doubles product every cycle. Real assays often amplify at 90% to 110% efficiency. If target and reference efficiencies differ, the standard formula can bias fold-change estimates. Advanced mode lets you enter target and reference efficiency percentages so the calculator can use an efficiency-corrected expression ratio.

Should I calculate ΔΔCt from raw Ct values or averaged Ct values?

Use biological replicates whenever possible, and average technical wells only after you remove failed wells with a clear rule. For each biological replicate, calculate or enter the target Ct and reference Ct from matching cDNA samples. Then compare group mean ΔCt values. Avoid mixing unmatched target and reference wells because ΔCt requires paired measurements from the same sample.