Effective Population Size Calculator

Calculate effective population size, Ne, from breeding sex ratio, family-size variance, bottleneck history, and expected heterozygosity loss. The calculator helps genetics students, conservation biologists, and breeding-program planners compare census size with the genetic size that controls drift.

Effective Population Size Calculator for Ne, drift, and heterozygosity

Change any input and the sex-ratio model, family-size variance model, bottleneck estimate, and heterozygosity projection update instantly.

Load an effective population size scenario

Start with a conservation, breeding, or classroom example, then adjust the values for your population.

Sex-ratio effective size inputs

Unequal breeding males and females reduce Ne even when census size looks large.

Breeding population and effective size diagramBreeding structure controls NeSex ratio, family-size variance, and bottlenecks shrink the genetic size of a population.Males: 50Females: 50Ne99.50

Family-size variance inputs

Higher variance in offspring number lets a few parents dominate the next generation.

Ne ≈ (4N − 2) / (Vk + 2)

Vk = 2 behaves like an ideal diploid population. Larger Vk reduces the genetic contribution of census size.

Bottleneck and heterozygosity inputs

Enter population sizes across generations. The harmonic mean gives heavy weight to the smallest bottleneck.

Gen 1: 100Gen 2: 100Gen 3: 100Gen 4: 100Gen 5: 100

Live Ne result

Limiting effective population size: 99.50

The smallest model estimate usually drives drift risk. This scenario shows high genetic drift pressure.

Census N

100

Ne/N

99.5%

ΔF/gen

0.503%

H retained

90.4%

Effective size model comparison

Compare the sex-ratio, family-size variance, and bottleneck estimates before choosing a biological interpretation.

Sex-ratio Ne100
Family-size variance Ne99.50
Bottleneck harmonic Ne100
Expected heterozygosity retention under genetic driftHeterozygosity over 20 generationsGeneration 0Generation 20Initial H

Genetic diversity projection

Initial heterozygosity H₀

0.4200

Projected heterozygosity Ht

0.3797

Heterozygosity lost

0.0403

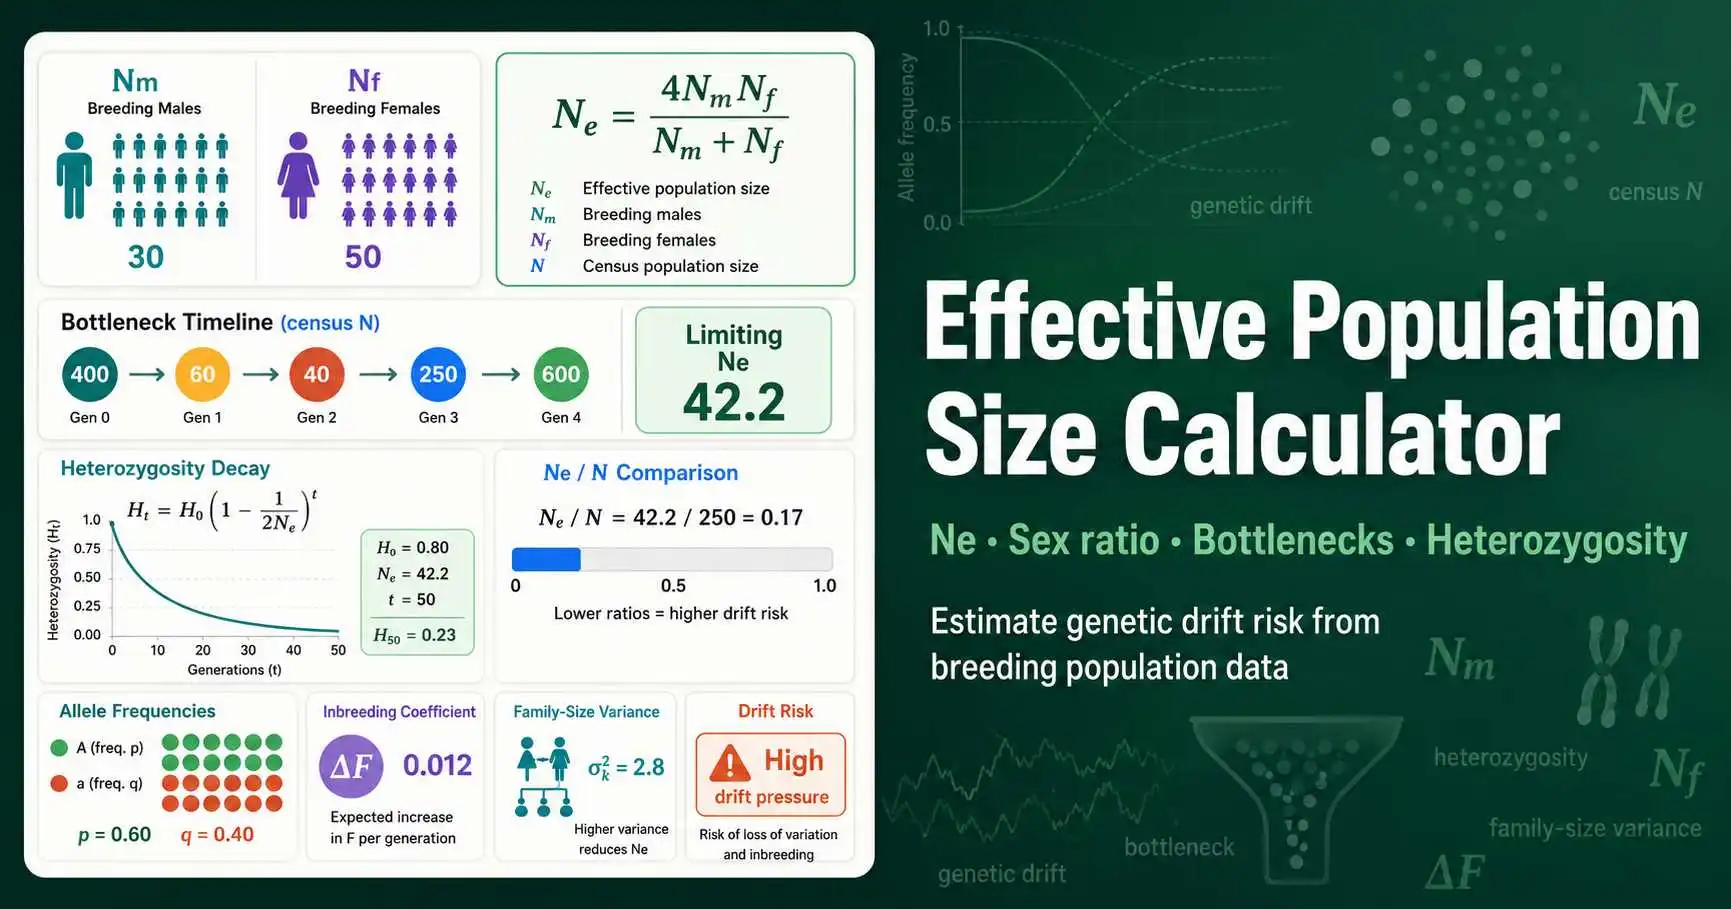
Effective population size diagram showing breeding sex ratio, bottleneck history, Ne values, and heterozygosity loss over generations
Figure 1. Effective population size connects breeding males Nm, breeding females Nf, reproductive variance Vk, and heterozygosity H into one estimate of drift intensity. The figure shows how a short bottleneck can reduce genetic diversity even after census population size recovers.

What is effective population size in population genetics?

Effective population size describes how many ideal breeding individuals would produce the same rate of genetic drift as the real population. Census size, written as N, counts bodies. Effective size, written as Ne, counts genetic contribution.

Sewall Wright introduced the concept while building the mathematical basis of random genetic drift. A skewed sex ratio, unequal family size, population subdivision, selection, and bottlenecks all push Ne below census size. Nature Education gives the sex-ratio equation Ne = 4NmNf / (Nm + Nf) for non-equal breeding sexes. Read the Nature Education explanation.

The same idea sits beside our genetic drift simulator. A smaller Ne makes allele-frequency paths wobble more strongly, so rare alleles reach loss or fixation faster.

How to use Effective Population Size Calculator

  1. 1

    Enter breeding males and females

    Type the number of reproductive males and reproductive females to calculate sex-ratio effective size.

  2. 2

    Add family-size variance

    Enter census size and variance in offspring number to estimate how reproductive skew changes Ne.

  3. 3

    Describe bottleneck history

    Enter population sizes across generations as a comma-separated list to calculate harmonic mean Ne.

  4. 4

    Read heterozygosity loss

    Use the projected heterozygosity graph to estimate genetic diversity retained after the selected generations.

What each part of Effective Population Size Calculator does

The preset buttons load common biological scenarios. A balanced population demonstrates the ideal case, while the skewed sex-ratio preset shows how a few breeding males can reduce genetic size.

The sex-ratio card calculates Ne from breeding males and breeding females. This section answers the common question, “Why does the genetic size shrink when one sex is rare?”

The family-size variance card estimates how unequal reproductive success changes effective size. Use it when one adult pair, founder line, or brood contributes more descendants than others.

The bottleneck input accepts a comma-separated time series. The output uses the harmonic mean, which gives strong weight to the smallest generation in the history.

The result banner highlights the limiting Ne, Ne/N, inbreeding rate, and heterozygosity retained. The chart then turns those values into a visible diversity trajectory.
Effective population size formulas used in the calculator

Each formula answers a different biological question. Use the table to choose the model that matches your data before interpreting the smallest estimate.

Sex ratio

Ne = 4NmNf / (Nm + Nf)

Unequal breeding males and females

Family-size variance

Ne ≈ (4N − 2) / (Vk + 2)

Unequal offspring number among breeders

Bottleneck history

Ne = t / Σ(1/Ni)

Population size changes through time

Heterozygosity retention

Ht = H0(1 − 1/(2Ne))ᵗ

Genetic diversity loss across generations

Effective population size worked examples

Example 1: skewed sex ratio lowers Ne

A population has 12 breeding males and 88 breeding females. Census size equals 100, but the sex-ratio formula gives Ne = 4 × 12 × 88 / 100 = 42.24.

The genetic population behaves like about 42 ideal breeders. This result helps explain why wildlife managers track breeding adults by sex, not just total headcount.

Example 2: a bottleneck dominates long-term Ne

A population changes through 400, 60, 40, 250, and 600 breeding individuals. The arithmetic mean equals 270, but the harmonic mean gives about 88.9.

The two small generations control the genetic outcome. After the population rebounds, lost rare alleles do not automatically reappear unless mutation or migration restores them.

Effective population size in conservation and breeding plans

Conservation geneticists use Ne to compare management options before diversity declines. A breeding plan that balances families can preserve more heterozygosity than a plan that lets one lineage dominate offspring production.

Population-genetics classes often pair this calculator with a Hardy-Weinberg calculator. Hardy-Weinberg expectations describe genotype proportions when drift, selection, migration, and mutation do not disturb allele frequencies. Effective size explains one major way that real populations break that ideal.

Long-term genomic diversity also depends on mutation. When you want to connect diversity loss with new variant input, compare Ne with the estimates from the mutation rate calculator.

How to interpret Ne/N ratio and heterozygosity loss

Ne/N compares genetic size with census size. A ratio near 1 means breeding contribution looks close to ideal. A ratio far below 1 means the census count overstates how many independent allele copies pass into the next generation.

Heterozygosity loss translates Ne into a diversity outcome. If initial heterozygosity is 0.50 and the retained value after 50 generations is 0.39, the population lost 0.11 units of expected heterozygosity under the model. This does not identify which alleles vanished, but it shows the expected genetic erosion.

Effective population size calculator assumptions

This calculator uses classroom models. Real populations may have overlapping generations, age structure, migration, selection, population subdivision, related parents, and changing survival rates. Those details can move genomic estimates away from the simplified values shown here.

Treat the output as an educational estimate. For conservation or breeding decisions, combine pedigree records, field demography, genome-wide markers, and expert review.

Effective Population Size Calculator FAQs

What does an effective population size calculator measure?
An effective population size calculator estimates Ne, the size of an ideal population that would lose genetic variation at the same rate as the real population. Census size counts individuals, but Ne tracks genetic drift, inbreeding, and allele-frequency variance. A population with 500 animals can behave genetically like 80 individuals when few adults breed. This tool compares sex-ratio, family-size variance, and bottleneck models so students can see which factor limits genetic diversity.
How do you calculate effective population size from sex ratio?
Use Ne = 4NmNf / (Nm + Nf), where Nm means breeding males and Nf means breeding females. A population with 50 males and 50 females gives Ne = 100. A population with 10 males and 90 females gives Ne = 36, even though census size still equals 100. The formula shows why skewed mating systems can accelerate drift.
Why is effective population size usually smaller than census size?
Ne shrinks when individuals contribute unequally to the next generation. Sex-ratio imbalance, reproductive skew, inbreeding, selection, and bottlenecks all reduce the number of independent allele copies passed forward. In a fish population, one female can release thousands of eggs while many juveniles die before breeding. Census size may look large, but the genetic contribution can come from a much smaller set of parents.
How does a bottleneck change effective population size?
A bottleneck lowers long-term Ne because the harmonic mean weights small generations strongly. If a population sequence is 1000, 50, 50, and 1000, the short low-size period dominates the result. The population may recover numerically after the bottleneck, but rare alleles can disappear during the small phase. This calculator uses a comma-separated population series to show that genetic effect directly.
What is the link between effective population size and heterozygosity?
Expected heterozygosity declines by about 1 / (2Ne) per generation in an ideal diploid population. The calculator applies Ht = H0(1 − 1/(2Ne))t. When Ne is small, the curve drops faster because random sampling removes alleles more often. Conservation geneticists use this relationship to compare management scenarios.
Can effective population size be larger than census size?
Some family-size models can produce Ne near or above census size when reproductive output is very evenly controlled. Natural populations rarely meet that condition. Most wild populations show variation in survival, mating success, fecundity, and recruitment. Those processes usually push Ne/N below 1, often far below 1 in species with high reproductive skew.
Is this effective population size calculator suitable for conservation decisions?
This tool supports education and first-pass scenario analysis. It does not replace demographic data, genomic estimates, or expert conservation planning. Real management decisions also need age structure, migration, kinship, mating system, survival, and habitat information. Use the calculator to understand direction and magnitude, then validate serious decisions with field and genomic evidence.

Use these tools to connect effective size with allele-frequency change, genotype proportions, and population-level assumptions.