Forked Line Method Calculator for Genetics Problems

Use the forked line method to solve dihybrid, trihybrid, and multi-trait inheritance questions without drawing a huge Punnett square. The calculator splits the cross into monohybrid branches, multiplies the selected probabilities, and reports the expected offspring count. It works best when genes assort independently.

Calculate forked-line probabilities from parent genotypes

Start with the classic AaBbCc × AaBbCc example or build a custom cross with up to five independent loci. Basic mode handles phenotype questions. Advanced mode adds genotype-branch probability.

Build a forked-line genetics problem

Choose the number of independent traits, set each monohybrid cross, then select the target phenotype.

Trait 1

Aa × Aa

Trait 2

Aa × Aa

Trait 3

Aa × Aa

Target phenotype result

42.19% probability

A: dominant trait A + B: dominant trait B + C: dominant trait C

Fraction

27/64

Expected

27.00

Quick interpretation

Selected branches: 3 of 3 phenotype branches.

Method: multiply the independent monohybrid probabilities.

Assumption: each locus assort independently. Linked genes need recombination data.

Classic check: AaBbCc × AaBbCc gives 27/64 for A_B_C_.

Live forked-line branches

Each row shows one monohybrid branch. Multiply the selected branch probabilities to get the final result.

Trait AAa × Aa
Dominant branch3/4
Recessive branch1/4
Trait BAa × Aa
Dominant branch3/4
Recessive branch1/4
Trait CAa × Aa
Dominant branch3/4
Recessive branch1/4

Phenotype combinations

These are the final branches after the calculator multiplies all trait probabilities.

A_B_C_42.19%

Expected count from 64: 27.00

A_B_cc14.06%

Expected count from 64: 9.00

A_bbC_14.06%

Expected count from 64: 9.00

aaB_C_14.06%

Expected count from 64: 9.00

A_bbcc4.69%

Expected count from 64: 3.00

aaB_cc4.69%

Expected count from 64: 3.00

aabbC_4.69%

Expected count from 64: 3.00

aabbcc1.56%

Expected count from 64: 1.00

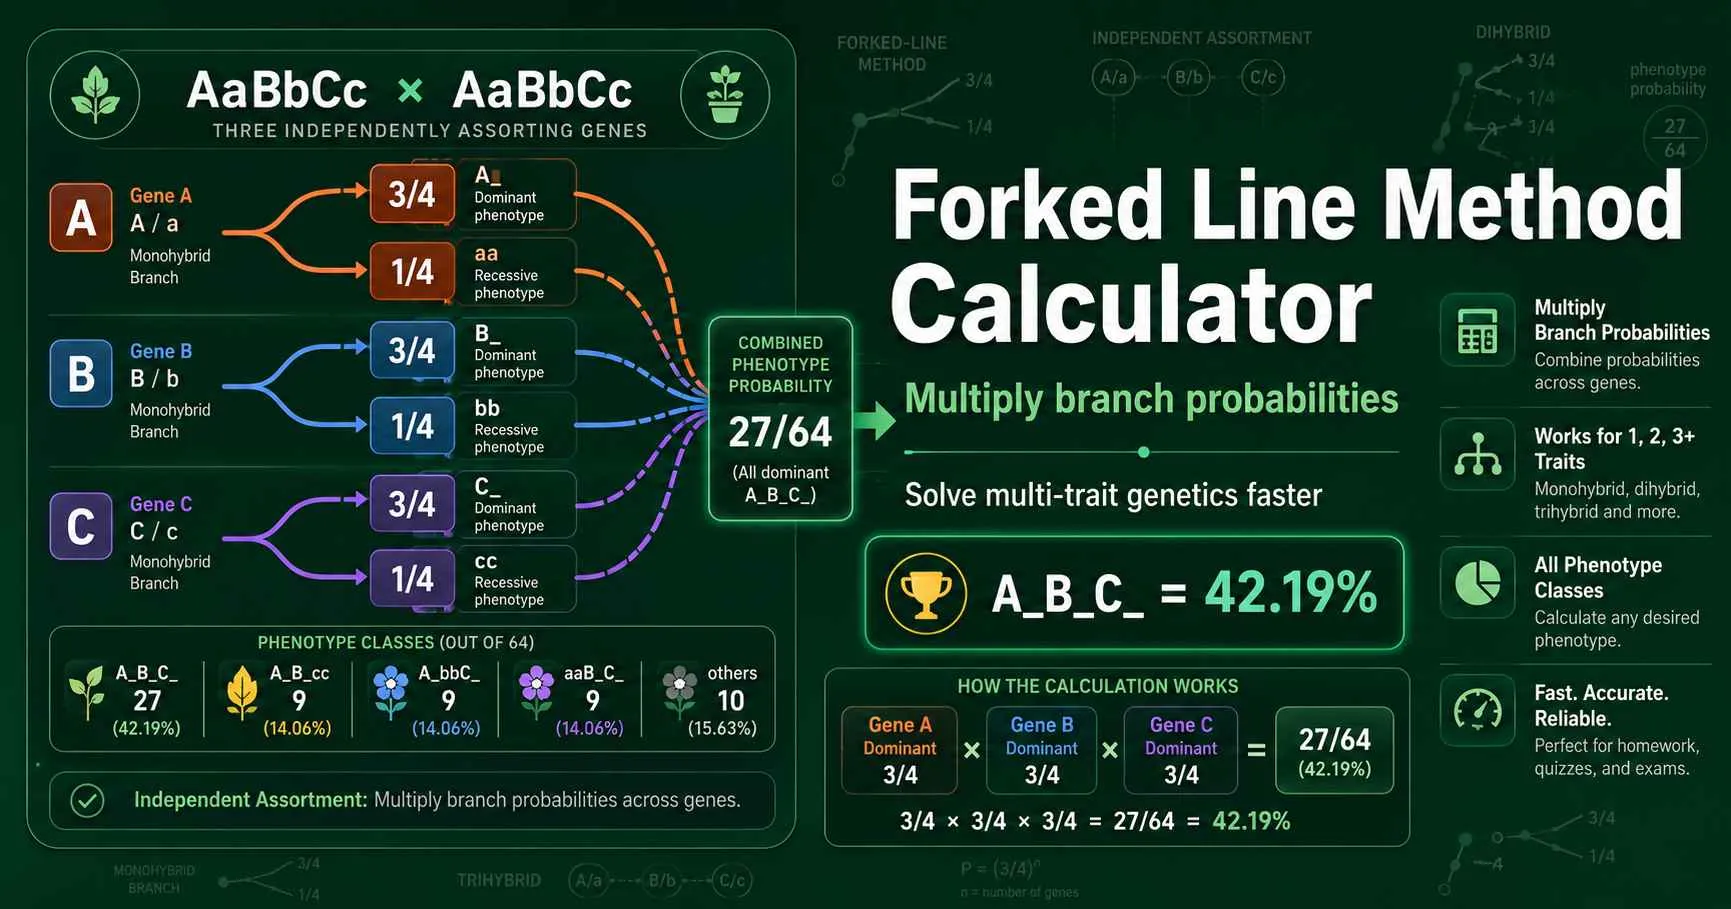
Forked line method genetics diagram showing independent monohybrid branches for A, B, and C loci multiplied into trihybrid offspring probabilities
Figure 1. The forked-line diagram separates the A, B, and C loci into monohybrid branches, then multiplies branch probabilities to predict offspring phenotypes. This approach reflects Mendel’s law of independent assortment when the loci sit on different chromosomes or far apart on the same chromosome.

Forked-line method meaning in genetics

The forked line method answers one common question: what is the probability of a specific multi-trait offspring phenotype? It treats each locus as a separate monohybrid cross. Then it multiplies the branch probabilities because independent events combine through the product rule.

Mendel’s law of independent assortment says allele sorting at one gene does not control allele sorting at another unlinked gene. OpenStax explains this principle with dihybrid crosses, where gamete combinations occur independently when genes are unlinked or effectively unlinked. Read the inheritance background.

Students often use this method after they understand a single-gene Punnett square. It gives the same result as a large grid when the traits assort independently, but it keeps the work readable.
What each part of the tool does

The calculator uses each input as one branch-building step. Read the table first if you want to understand the result before copying it into a lab report or homework answer.

Trait count

Sets how many independent loci the problem includes. Dihybrid uses two, trihybrid uses three.

Parent genotypes

Builds each monohybrid branch from AA, Aa, or aa parent combinations.

Target phenotype

Selects dominant, recessive, or any branch at each locus.

Expected offspring count

Converts probability into predicted offspring numbers for a sample size.

Advanced genotype branch

Multiplies exact genotype probabilities such as Aa, BB, or cc.

Forked-line probability formula

One locus

Aa × Aa gives 3/4 dominant phenotype and 1/4 recessive phenotype.

Multiple loci

Multiply each selected branch. A_B_cc equals 3/4 × 3/4 × 1/4.

Expected count

Expected offspring equals probability multiplied by total offspring number.

LibreTexts describes the forked-line method as a scalable way to calculate genotypic and phenotypic probabilities from crosses with multiple characteristics. Review the forked-line explanation.

Worked genetics examples using branch multiplication

AaBbCc × AaBbCc: all-dominant phenotype

Each locus gives a 3/4 dominant phenotype branch. Multiply the three branches: 3/4 × 3/4 × 3/4 = 27/64. That equals 42.1875%.

If the cross produces 640 offspring, the expected count for A_B_C_ equals 640 × 27/64 = 270 offspring. Use a Mendelian ratio chi-square test when you want to compare those expected counts with observed data.

AaBbCc × aabbcc: test-cross phenotype

Each locus gives a 1/2 dominant and 1/2 recessive branch. The phenotype A_bbC_ uses 1/2 × 1/2 × 1/2 = 1/8. That equals 12.5%.

A true independent trihybrid test cross produces eight phenotype classes at 1/8 each. Unequal classes can suggest linkage, viability differences, or phenotype-scoring problems. Check a genetic linkage calculator if parental classes dominate the result.

When branch multiplication gives the wrong answer

The method assumes independent assortment. Linked genes break that assumption because parental allele combinations appear more often than recombinant combinations. Close linkage can make a test cross look nothing like the expected 1:1:1:1 or 1:1:1:1:1:1:1:1 ratio.

Epistasis also changes the final phenotype ratio. The genotype probabilities may still multiply, but gene interaction changes how those genotypes map to visible traits. Recessive epistasis, dominant epistasis, and complementary genes can all collapse multiple branches into one phenotype class.

Forked-line method FAQs

What does the forked line method calculate?

The forked line method calculates offspring probabilities by treating each gene as a separate monohybrid cross. You find the probability for one branch at each locus, then multiply those branch probabilities together. This works well for independent traits because the allele outcome at one locus does not change the probability at another locus. For AaBbCc × AaBbCc, the all-dominant phenotype equals 3/4 × 3/4 × 3/4, or 27/64.

When should I use a forked line method instead of a Punnett square?

Use a forked line method when a cross has two or more independently assorting genes. A dihybrid Punnett square has 16 cells, but a trihybrid Punnett square has 64 cells. Four traits produce 256 genotype combinations. The forked-line approach gives the same independent-assortment probabilities with less drawing and fewer transcription errors.

How do I solve AaBbCc × AaBbCc with this method?

Break the cross into three monohybrid crosses: Aa × Aa, Bb × Bb, and Cc × Cc. Each locus gives a 3/4 dominant phenotype probability and a 1/4 recessive phenotype probability. Multiply the target branches. For the A_B_C_ phenotype, calculate 3/4 × 3/4 × 3/4 = 27/64, which equals 42.1875%.

Can the tool calculate genotype probabilities too?

Yes. Switch to Advanced mode and select a genotype branch at each locus. For Aa × Aa, the genotype probabilities are 1/4 AA, 1/2 Aa, and 1/4 aa. A target such as AaBbcc uses 1/2 × 1/2 × 1/4. That equals 1/16, or 6.25% of offspring under independent assortment.

Why does the calculator ask for an expected offspring count?

The expected offspring count converts a probability into a predicted number of offspring. If a phenotype has probability 27/64 and you expect 640 offspring, the predicted count equals 270. This number helps students compare theoretical ratios with observed offspring counts. You can later test those observed counts with a Mendelian ratio chi-square test.

Does the forked line method work for linked genes?

No. The standard forked-line method assumes independent assortment. Linked genes sit on the same chromosome and often travel together unless crossing over separates them. If two loci show linkage, you need recombination frequency or map distance in centimorgans. In that case, use a genetic linkage workflow rather than multiplying independent monohybrid branches.

Can I use this for epistasis ratios?

Use caution. The forked line method can still generate genotype probabilities under independent assortment, but epistasis changes how genotypes collapse into phenotypes. For example, recessive epistasis can convert a standard 9:3:3:1 dihybrid ratio into 9:3:4. Use an epistasis-specific tool when one gene masks or modifies another gene.