Hardy-Weinberg Equilibrium Examples (Real Cases)
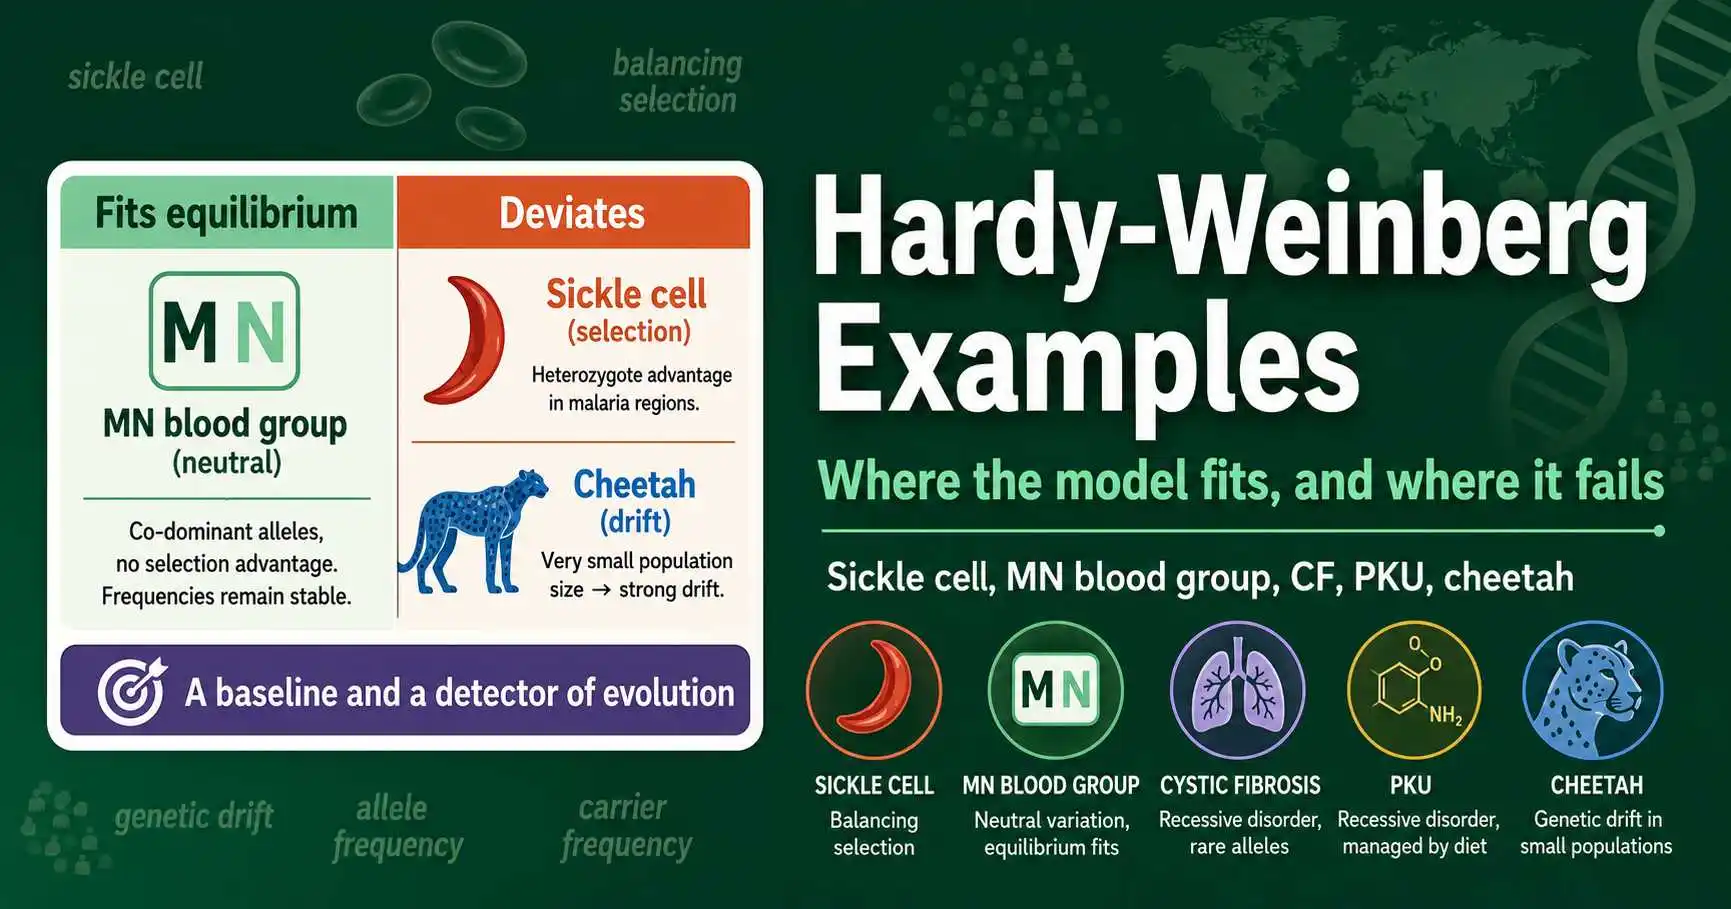
The most instructive Hardy-Weinberg examples come in two kinds: real populations that closely fit the equilibrium prediction, and ones that clearly depart from it. The MN blood group fits well because it is selectively neutral and mating does not depend on it in any way. Sickle cell anemia famously departs from equilibrium, because heterozygotes resist malaria, the classic textbook case of balancing selection. Cystic fibrosis and PKU show how the equation estimates carrier frequencies for real recessive diseases, while the cheetah illustrates genetic drift after a population bottleneck reduced the species to a fraction of its former diversity.
These cases turn an abstract equation into something concrete, showing both where Hardy-Weinberg succeeds as a model and where the gap between prediction and reality reveals evolution actively at work in real populations. This guide works through each example with real figures, explaining what the numbers mean and which evolutionary principle each illustrates. The calculations behind any of these cases can be run with a calculator, but the examples themselves are what make the principle memorable.
Two Kinds of Example: Fit and Deviation
Before the specific cases, it helps to understand why examples come in two flavors, because each teaches something different. Hardy-Weinberg equilibrium is a null model, a prediction of what a non-evolving population looks like, so comparing real data to it can either confirm a fit or reveal a deviation.
Examples that fit the prediction show the model working as a description. When a real population's genotype frequencies match the p², 2pq, q² values calculated from its allele frequencies, the population appears to be in equilibrium for that gene, suggesting no strong evolutionary force is acting on it. The MN blood group is the classic fitting example. These cases reassure us that the model is sound and that, under the right conditions, real populations really do approximate equilibrium.
Examples that deviate from the prediction are arguably more interesting, because the deviation itself is the discovery. When observed genotype frequencies differ significantly from the equilibrium prediction, it signals that one of the five conditions is violated and that an evolutionary force is at work. Sickle cell anemia is the most famous deviating example, where an excess of heterozygotes points to selection. Both kinds of example are valuable: the fitting cases validate the model, and the deviating cases use it as a detector of evolution. This dual role, baseline and detector, is the thread running through every example below.
Sickle Cell Anemia and Malaria
Sickle cell anemia is the most celebrated Hardy-Weinberg example, because it dramatically illustrates how natural selection can maintain a harmful allele at high frequency. In some West African populations, the sickle cell allele reaches frequencies of 10 to 15 percent, far higher than a harmful recessive allele should reach if selection simply removed it.
The explanation is heterozygote advantage, a form of balancing selection. There are three genotypes: individuals with two normal alleles, individuals with two sickle cell alleles who have sickle cell disease, and heterozygotes who carry one of each. In regions where malaria is common, the heterozygotes have the highest fitness, because their single sickle cell allele provides resistance to malaria while their normal allele prevents the full disease. Individuals with two normal alleles remain vulnerable to malaria, and those with two sickle cell alleles suffer the disease, so both homozygotes have lower fitness than the heterozygote.
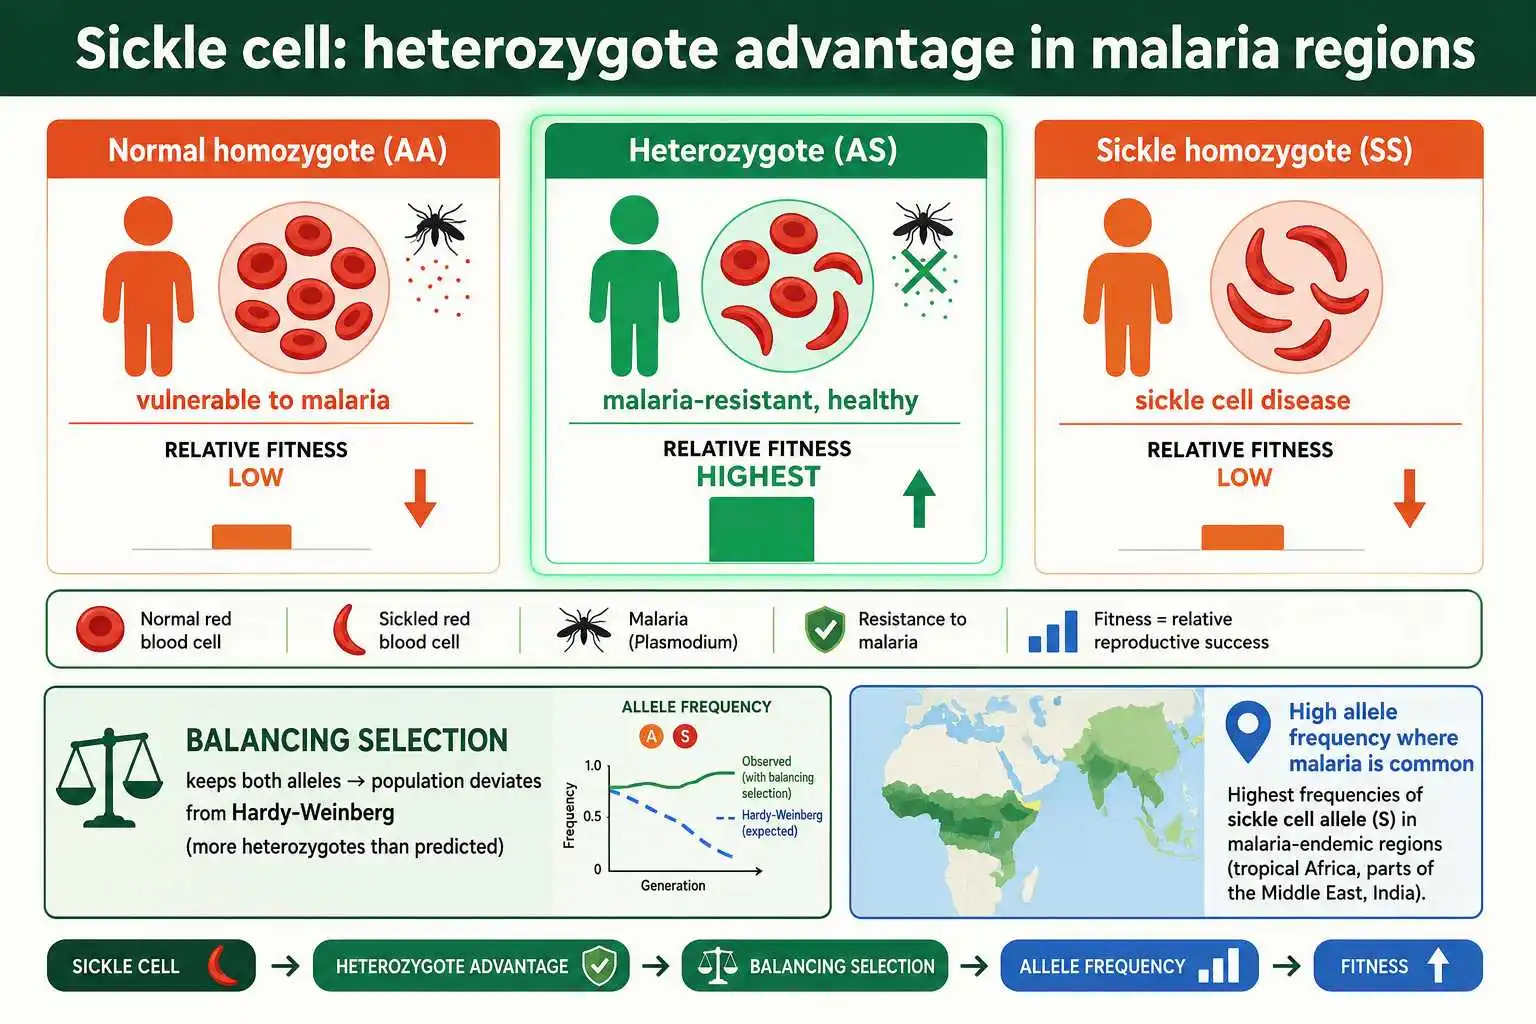
This is why the population deviates from Hardy-Weinberg equilibrium. Selection favors the heterozygote, so the sickle cell allele persists at a much higher frequency than its harmful homozygous effect alone would allow, and the observed frequency of heterozygotes exceeds the equilibrium prediction. With an allele frequency around 10 to 15 percent, Hardy-Weinberg calculations predict roughly 1 to 2 percent of individuals affected by sickle cell disease and 20 to 30 percent as carriers with malaria resistance. The geographic correlation seals the case: where malaria is common, the sickle cell allele frequency is high, and where malaria is absent, the allele frequency is low, exactly as a malaria-driven selective advantage predicts.
This geographic pattern also explains what happens when populations move. When people from malaria-endemic regions, where the sickle cell allele is common, settle in areas without malaria, the selective advantage of the heterozygote disappears. Without malaria, the heterozygote no longer has higher fitness than the normal homozygote, while the disease in homozygotes still carries a cost. Over many generations, this is expected to slowly reduce the allele frequency in the new environment, though the change is gradual because most copies of the allele remain sheltered in healthy carriers. The sickle cell story is therefore not static but tracks the selective pressure of malaria across both geography and time, a vivid demonstration of selection responding to the environment. This connection between a recessive disorder and a selective pressure is explored further in our guide on genetic disorders and Punnett squares.
The MN Blood Group: A Population That Fits
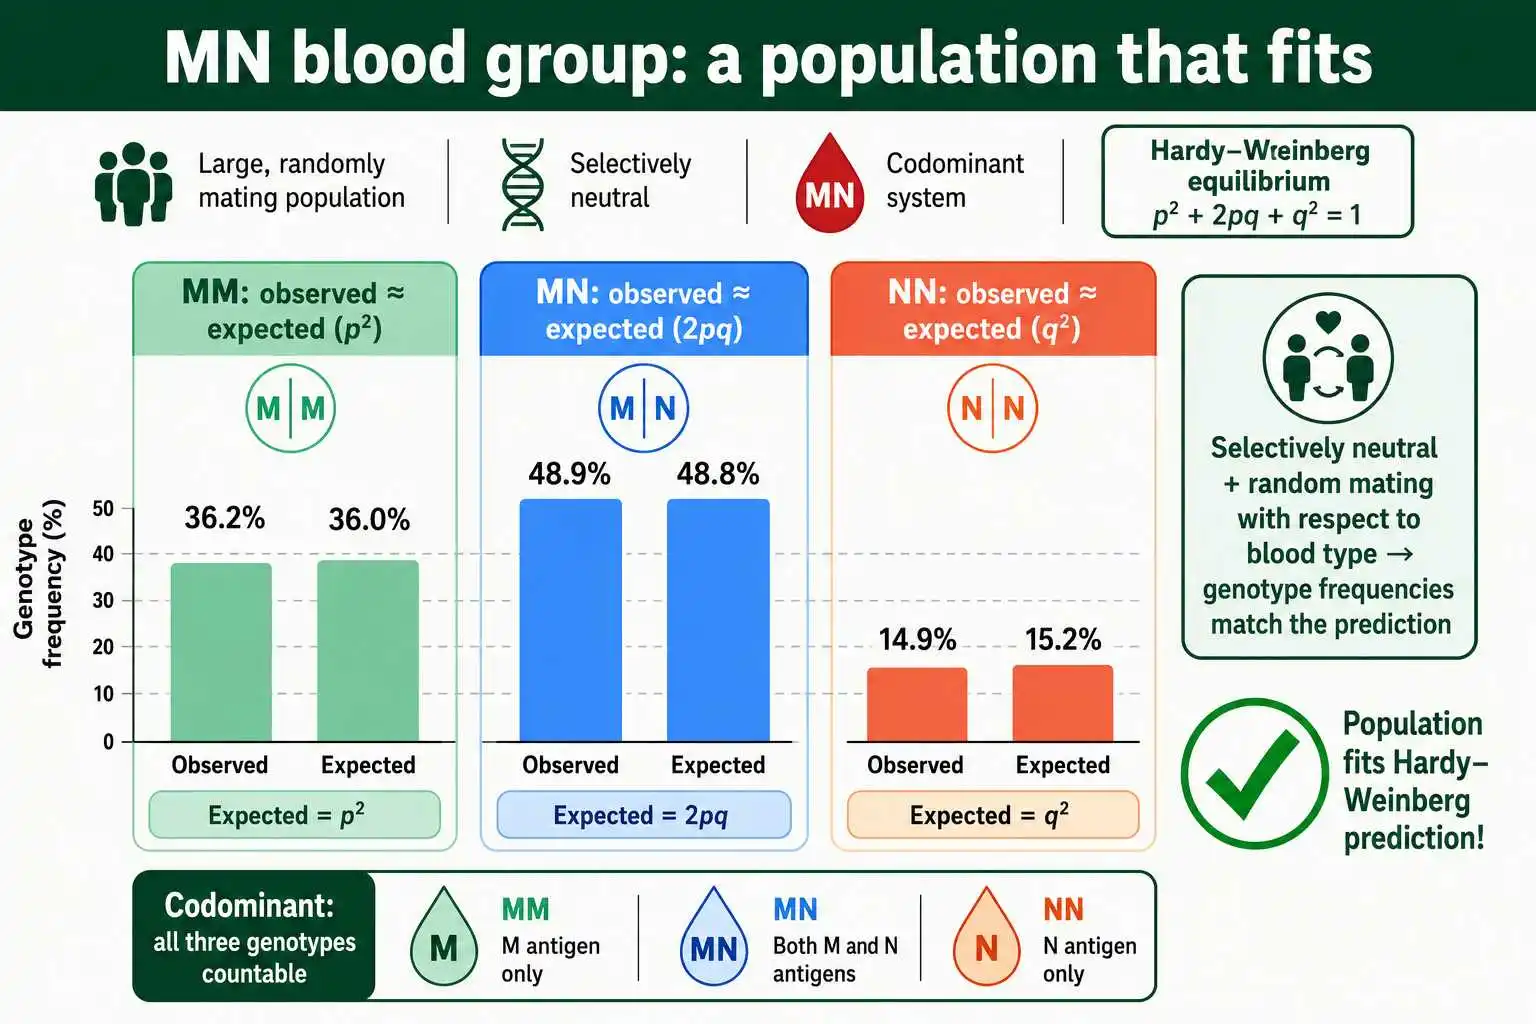
In contrast to sickle cell, the MN blood group is the textbook example of a population that closely fits Hardy-Weinberg equilibrium. This human blood group system, separate from the more familiar ABO system, has two codominant alleles, M and N, giving three distinguishable genotypes: MM, MN, and NN.
The MN system fits the equilibrium prediction for two key reasons. First, the MN blood type appears to be selectively neutral, meaning it has little or no effect on survival or reproduction, so natural selection does not push the allele frequencies in any direction. Second, people do not choose mates based on their MN blood type, so mating is effectively random with respect to this gene. With no selection and random mating, two of the most disruptive forces are absent, and the genotype frequencies stay close to the p², 2pq, q² prediction.
Because all three genotypes are distinguishable through codominance, the MN system is ideal for testing Hardy-Weinberg. Researchers can directly count MM, MN, and NN individuals, calculate the allele frequencies, predict the expected genotype counts, and compare. In study after study, real MN data come out very close to the equilibrium prediction, with any small differences attributable to ordinary sampling variation rather than a real evolutionary force. The MN blood group thus serves as a reassuring demonstration that, when the conditions are approximately met, the Hardy-Weinberg model genuinely describes real populations.
 The statistical comparison used to confirm such a fit is detailed in our guide on testing Hardy-Weinberg with chi-square.
Cystic Fibrosis: Estimating Carriers
Cystic fibrosis is a leading example of using Hardy-Weinberg to estimate carrier frequencies for a real recessive disease, which has direct importance for genetic counseling and screening. In northern European populations, cystic fibrosis affects roughly 1 in 2,500 people.
Applying the equation reveals the hidden carriers. The affected individuals are homozygous recessive, so q² equals 1 in 2,500, which is 0.0004. The square root gives q equals 0.02, or 1 in 50. Then p equals 0.98. The carrier frequency 2pq is 2 times 0.98 times 0.02, giving approximately 0.0392, or about 1 in 25. So while only 1 in 2,500 people has cystic fibrosis, roughly 1 in 25 carries the allele, one hundred times more common than the disease itself.
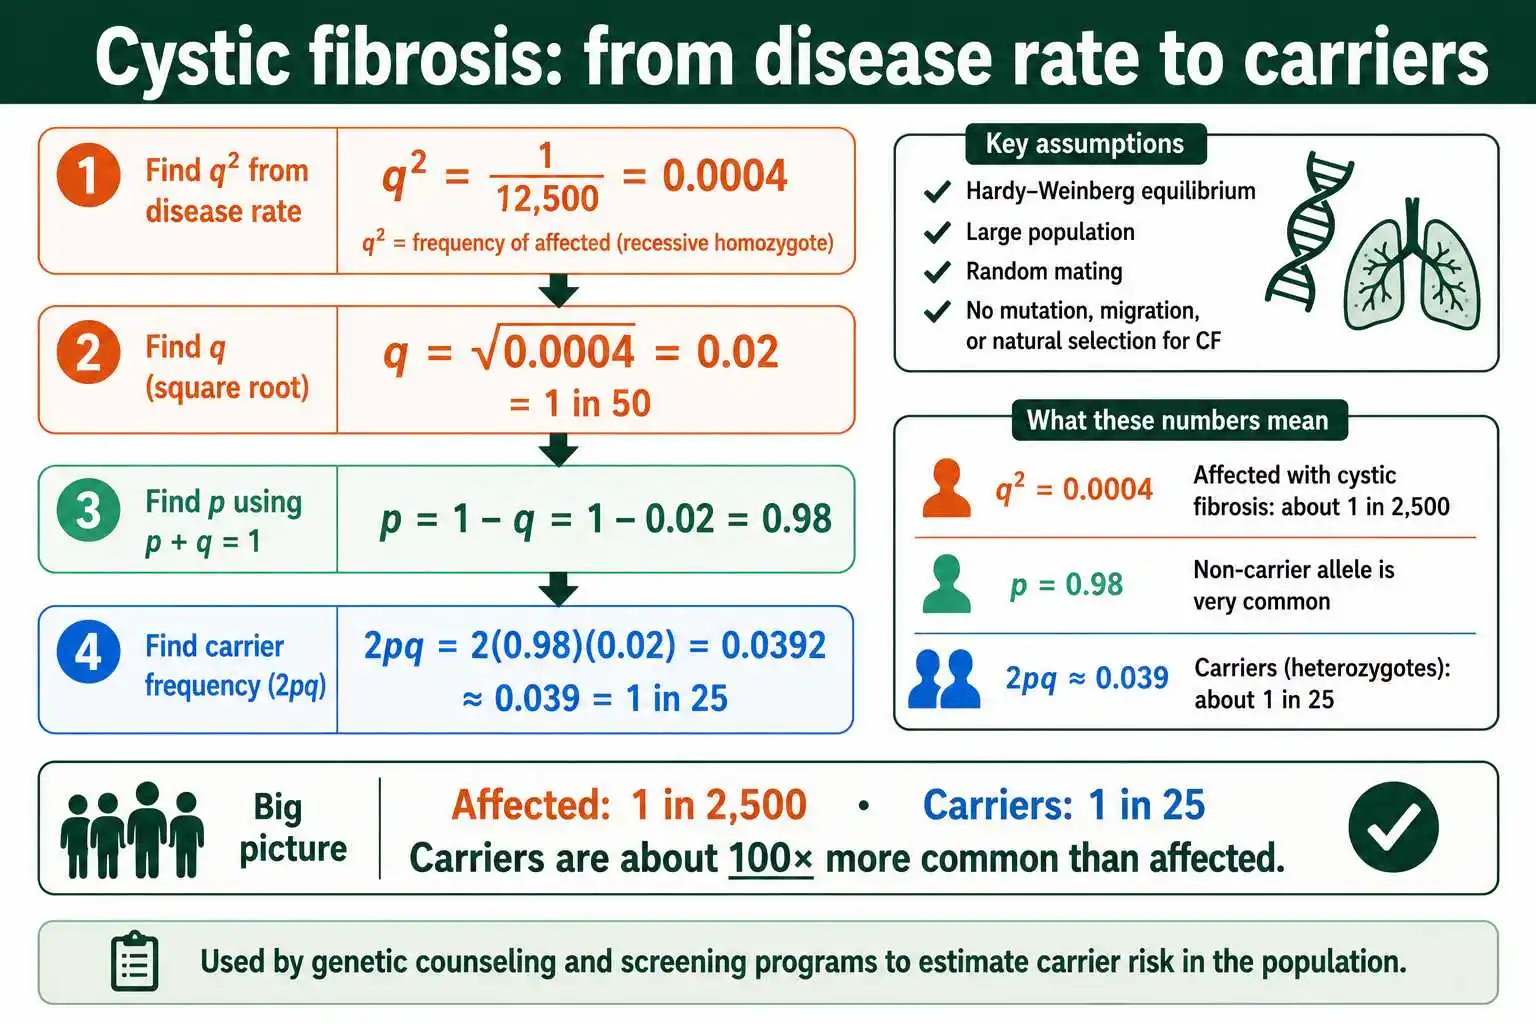
This example shows the practical power of Hardy-Weinberg in medicine. The disease incidence is something public health systems can measure directly, and from that single number the equation reveals the much larger carrier population that would otherwise be invisible. Genetic counselors use these carrier frequencies to estimate the chance that two prospective parents are both carriers, and screening programs use them to plan their scope. The cystic fibrosis numbers, with carriers far outnumbering affected individuals, are typical of recessive diseases and explain why so many people carry disease alleles without any family history. The full carrier calculation method is covered in our guide on Hardy-Weinberg carrier frequency.
PKU and Screening Programs
Phenylketonuria, or PKU, provides another real example where Hardy-Weinberg supports public health planning. PKU is a recessive metabolic disorder, and its incidence varies markedly between populations, which itself is genetically informative.
The standard figure for European-descended populations is an incidence of about 1 in 10,000. So q² equals 0.0001, giving q equals 0.01, and p equals 0.99. The carrier frequency 2pq is 2 times 0.99 times 0.01, which is about 0.0198, or roughly 1 in 50. As with cystic fibrosis, carriers vastly outnumber affected individuals, here by a factor of two hundred. These calculations directly inform newborn screening programs, helping officials estimate how many affected infants and carriers to expect and judge the cost-effectiveness of universal screening.
The variation in PKU incidence between populations is itself a Hardy-Weinberg lesson. PKU is considerably more common in some European-descended populations than in many African or Asian populations, where it is much rarer. Different populations simply have different allele frequencies, the result of their distinct histories of drift, selection, and founder effects. This illustrates that allele frequencies are properties of specific populations, not universal constants, which is why carrier-frequency estimates must use the relevant population's data. It also shows Hardy-Weinberg working alongside the forces that shape allele frequencies, a topic covered in our guide on what disrupts Hardy-Weinberg equilibrium.
The screening application is worth dwelling on, because it shows the equation guiding real resource decisions. Public health officials weighing whether to screen every newborn for a condition need to know how many affected infants and carriers to expect, and the Hardy-Weinberg estimate provides exactly that. As one survey of practical applications notes, these calculations help determine the cost-effectiveness of screening programs and allocate resources where they will do the most good. A condition common enough in a population to justify universal screening in one region might be rare enough elsewhere that targeted screening makes more sense, and the allele frequency, fed through the equation, is what distinguishes the two cases.
The Cheetah: Genetic Drift After a Bottleneck
The cheetah offers a different kind of example, illustrating not equilibrium but the dramatic effect of genetic drift following a population bottleneck. Cheetahs are famous among biologists for their unusually low genetic diversity, far lower than most mammal species.
The explanation lies in the cheetah's history. The species is thought to have passed through one or more severe population bottlenecks, possibly around 10,000 years ago, when its numbers crashed to a very small level. When a population shrinks so drastically, the survivors carry only a small, random sample of the original genetic variation, and many alleles are lost purely by chance. This is genetic drift acting powerfully in a small population, and it leaves a lasting signature of reduced diversity even after the population recovers in size.
The cheetah illustrates why the large-population assumption matters for Hardy-Weinberg. In a small population, drift overwhelms the stabilizing tendency that keeps allele frequencies constant in large populations, so equilibrium does not hold and variation is lost. The cheetah's low diversity is a real-world consequence of violating the large-population condition, and it has practical implications for conservation, since low genetic diversity can make a species more vulnerable to disease and less able to adapt. This case pairs naturally with the sickle cell example: where sickle cell shows selection driving a deviation from equilibrium, the cheetah shows drift doing the same through an entirely different mechanism.
Tay-Sachs and Population-Specific Frequencies
Tay-Sachs disease offers another instructive example, this time emphasizing how dramatically allele frequencies can differ between populations. Tay-Sachs is a severe recessive disorder, and its incidence is far higher in certain populations than in others.
In the Ashkenazi Jewish population, Tay-Sachs historically had an incidence of about 1 in 3,600 births, much higher than in most other groups. Applying Hardy-Weinberg, q² equals roughly 1 in 3,600, giving q of about 0.017 and a carrier frequency 2pq of roughly 1 in 30. This elevated carrier frequency, compared to a far lower rate in the general population, reflects the distinct genetic history of the population, including past bottlenecks and founder effects that raised the allele frequency. The same disease allele is simply more common in this gene pool.
The lesson is that Hardy-Weinberg calculations are always population-specific, because allele frequencies are properties of particular populations rather than universal values. A carrier-frequency estimate that is accurate for one population can be quite wrong for another, which is why genetic screening programs are often targeted at populations with elevated allele frequencies. Tay-Sachs screening in the Ashkenazi Jewish population is a notable public health success, dramatically reducing the incidence of the disease through carrier testing and counseling informed by exactly these Hardy-Weinberg estimates. The example reinforces that the equation is a tool applied to specific populations with their own histories, not a one-size-fits-all constant.
Reading What a Deviation Reveals
A skill that ties these examples together is learning to read what a particular deviation from equilibrium suggests about the underlying cause. While a deviation alone cannot prove which force is acting, the pattern of the deviation often points strongly toward one.
An excess of heterozygotes above the equilibrium prediction, as in sickle cell in malaria regions, suggests balancing selection favoring the heterozygote. The opposite, an excess of homozygotes and a shortage of heterozygotes, suggests non-random mating such as inbreeding, which concentrates matching alleles together without changing allele frequencies. A steady directional change in an allele's frequency across generations points to directional selection or gene flow, while the random loss of alleles in a small population, as in the cheetah, indicates genetic drift.
These diagnostic patterns make Hardy-Weinberg a genuine investigative tool rather than a mere calculation. When a real population deviates from the prediction, the direction and nature of the deviation become clues to the evolutionary process responsible. The investigation rarely ends there, since real populations often experience several forces at once, but the equilibrium comparison provides the essential starting point. This is the deeper reason the examples matter: each one is a worked case of using the model to move from a set of numbers to an understanding of the forces shaping a population, which is the central activity of population genetics.
What These Examples Teach Together
Taken as a set, these examples convey the core lesson of population genetics better than the equation alone ever could. Each illustrates a different relationship between real populations and the Hardy-Weinberg model, and together they show the model's dual role as both a description and a detector.
The fitting example, the MN blood group, shows that real populations genuinely can approximate equilibrium when the conditions are roughly met, validating the model as a sound description of a non-evolving population. The deviating examples, sickle cell and the cheetah, show the model working as a detector: the gap between prediction and observation reveals an evolutionary force, selection in the case of sickle cell and drift in the case of the cheetah. The disease examples, cystic fibrosis and PKU, show the model as a practical tool, turning measurable disease incidence into the hidden carrier frequencies that medicine needs.
The unifying insight is that Hardy-Weinberg is valuable precisely because real populations sometimes match it and sometimes do not. A match suggests stability; a mismatch points to an active evolutionary process. This is why the principle, despite describing an idealized situation that never perfectly exists, sits at the foundation of the field. The examples make the abstraction tangible: behind each set of frequencies is a real population shaped by real forces, and the equation is the lens that brings those forces into view.
Frequently Asked Questions
Why is sickle cell anemia a Hardy-Weinberg example?
Because it dramatically illustrates a deviation from equilibrium caused by balancing selection. In malaria regions, heterozygotes resist malaria and have the highest fitness, so the sickle cell allele persists at high frequency and heterozygotes exceed the equilibrium prediction, signaling selection at work.
Which real population fits Hardy-Weinberg equilibrium well?
The MN blood group is the classic fitting example. Because the MN type is selectively neutral and mating does not depend on it, its genotype frequencies stay very close to the p², 2pq, q² prediction, with deviations attributable to ordinary sampling variation.
How is Hardy-Weinberg used for cystic fibrosis?
It estimates carrier frequency from disease incidence. With cystic fibrosis affecting about 1 in 2,500 northern Europeans, the equation gives a carrier frequency of roughly 1 in 25, far higher than the disease rate, which helps genetic counseling and screening programs.
What does the cheetah illustrate about Hardy-Weinberg?
It illustrates genetic drift after a population bottleneck. A historic crash in cheetah numbers left the species with very low genetic diversity, showing how violating the large-population condition lets chance, rather than selection, eliminate variation and push a population out of equilibrium.
Where the Numbers Come Alive
The real value of Hardy-Weinberg examples is that they show the model doing two jobs at once. In populations like the MN blood group, the equation describes a genuine near-equilibrium, confirming the model is sound. In cases like sickle cell and the cheetah, the gap between prediction and reality detects evolution in action, balancing selection in one case and genetic drift in the other. And for diseases like cystic fibrosis and PKU, the equation turns a measurable disease rate into the carrier frequencies that medicine depends on.
Together these cases make the abstract principle concrete and memorable, and they reveal why population geneticists treat the equilibrium as both a baseline and a detector. You can explore the calculations behind any of these examples with the Hardy-Weinberg allele frequency calculator, entering real frequencies to see how prediction and observation compare. For a detailed teaching case on sickle cell and population genetics, this case study from HHMI BioInteractive is an excellent resource to explore further, with figures and data you can analyze yourself.
This article discusses genetic conditions for educational purposes. If you have personal concerns about an inherited condition or carrier status in your family, a licensed genetic counselor or physician is the right source for guidance tailored to your situation.