How to Calculate Mutation Rate
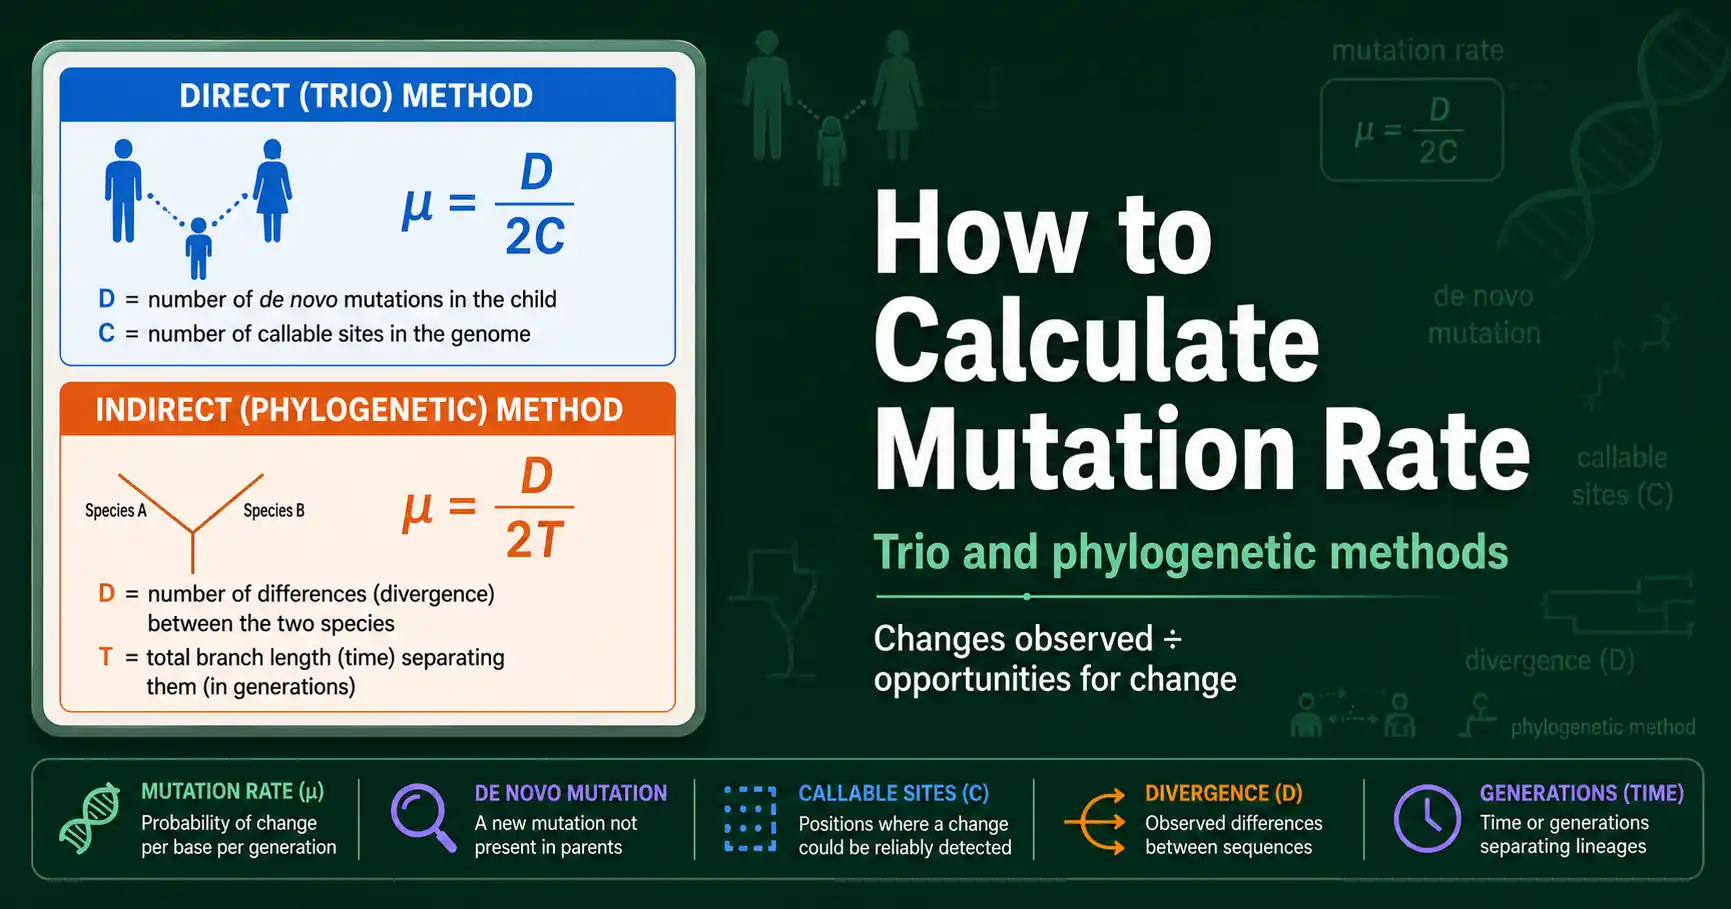
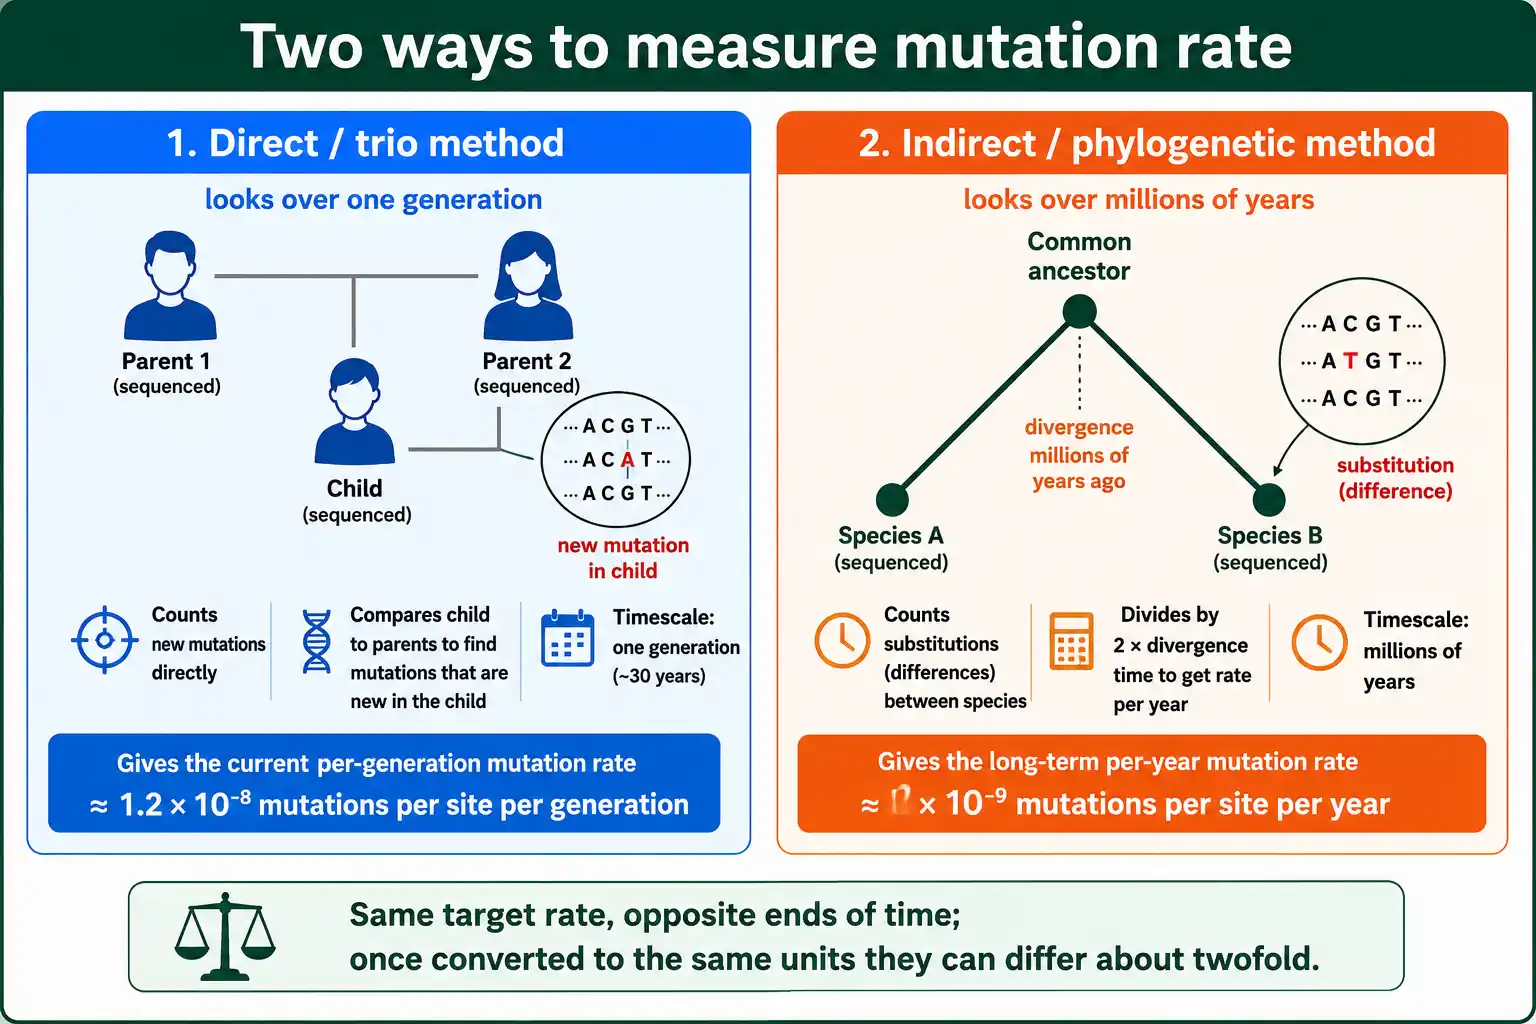
There are two main ways to calculate a mutation rate. The direct method counts new mutations in offspring by sequencing parents and their children, then divides by the number of sites examined. The indirect method compares DNA between species and divides their divergence by the time since they split. Both aim at the same number, the per-site mutation rate, from opposite ends of time.
This guide works through both, with the formulas and a worked example for each. It covers the trio method and its callable-sites correction, the phylogenetic method and its divergence-over-time logic, why the two can disagree, and the pitfalls that shift the answer. For the concept first, our explainer on what mutation rate is sets it up.
The Direct Method: Counting New Mutations
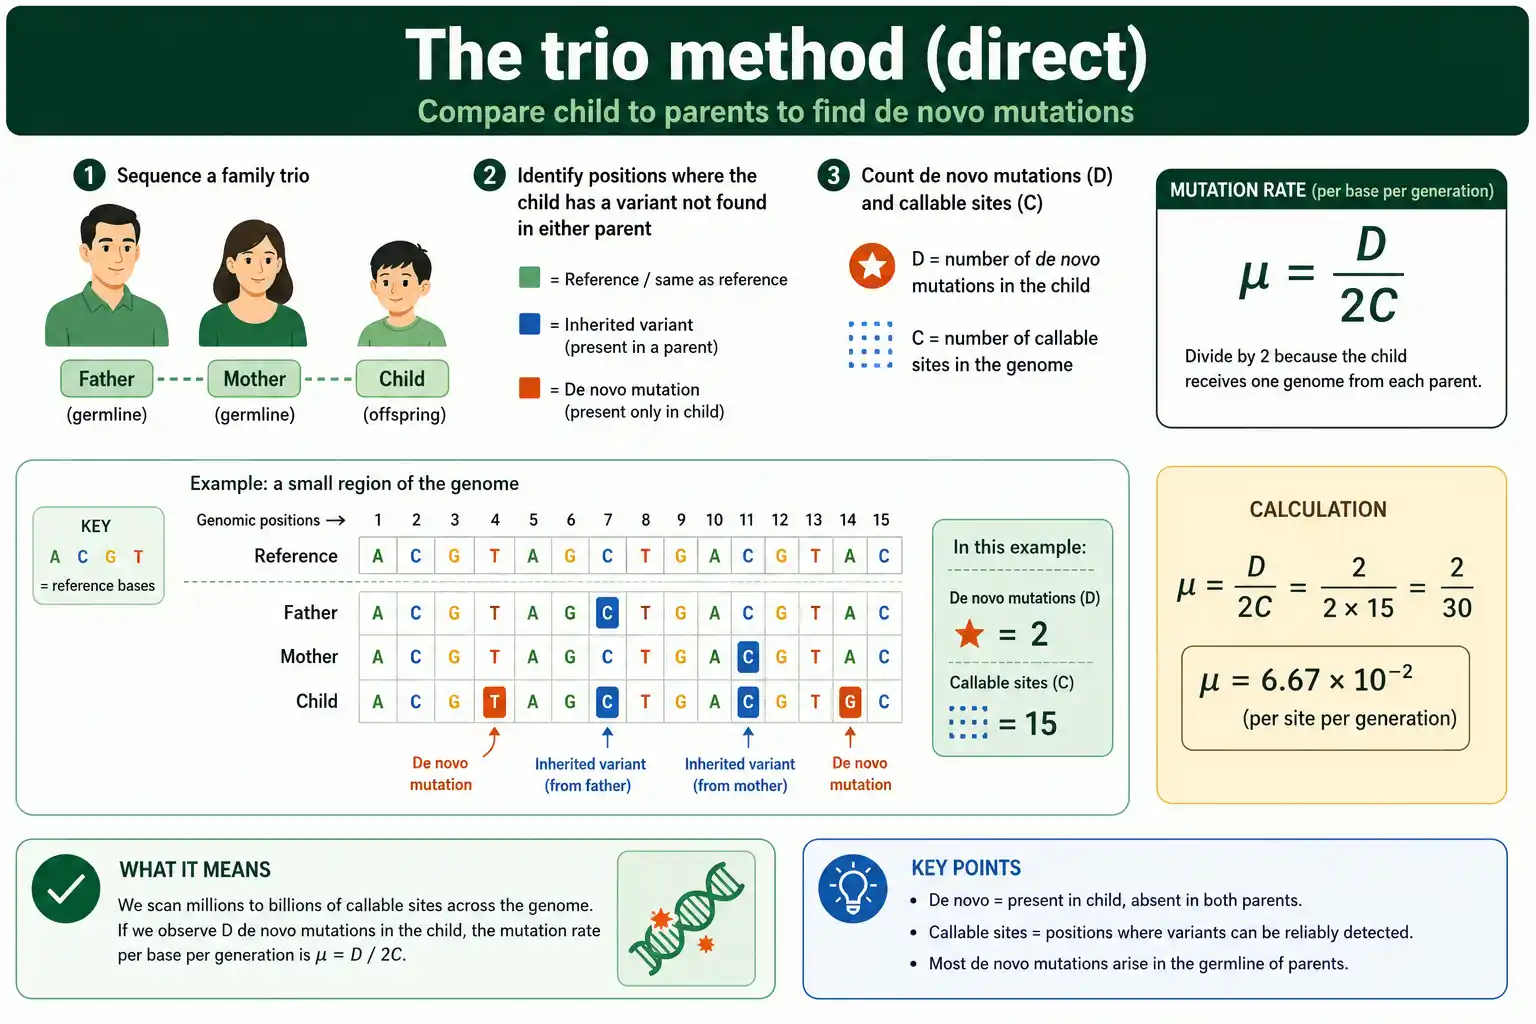
The direct method, also called the trio or pedigree method, is conceptually simple: sequence a mother, a father, and their child, then count the genetic changes present in the child but in neither parent. Those de novo mutations, divided by the amount of genome examined, give the rate.
The method became practical only with cheap whole-genome sequencing, because finding a few dozen new mutations among billions of bases demands deep, accurate reads of all three individuals. You align the child's genome against both parents', flag every position where the child carries an allele neither parent has, and filter those candidates hard to remove sequencing errors. What survives is the set of true de novo mutations.
This is the gold-standard method for the current, per-generation rate, because it measures mutations as they happen in one generation rather than inferring them over millions of years. It is how the human figure of roughly 70 new mutations per genome, or 1.2 x 10^-8 per base, was established. The catch is that it requires pedigrees and is exquisitely sensitive to how the candidate mutations are filtered.
Deep sequencing also lets researchers assign each new mutation a parental origin, by checking which parent's haplotype the mutation sits on. This is how studies showed that most human de novo mutations, around 80 percent, arise on the paternal copy, and that the count climbs with the father's age. Three-generation pedigrees, which sequence grandparents, parents, and children, push this further, separating mutations that arose in the parents' germlines from those that arose earlier and were carried as mosaics. These refinements do not change the basic ratio formula, but they show how much biological detail a well-designed trio study can extract beyond the single headline rate.
The Trio Formula
The per-site, per-generation mutation rate from a trio is the number of de novo mutations divided by twice the number of callable sites. The formula looks like this:
µ = D / (2 × C)
Here D is the number of de novo mutations found in the child, and C is the number of callable sites, the positions where a mutation could reliably have been detected. The factor of two is essential and often forgotten: a diploid child has two copies of the genome, one from each parent, so each callable site represents two chances for a mutation to have arisen and been seen.
Callable sites matter as much as the mutation count. You cannot use the whole genome as the denominator, because many positions have too little or too much sequencing coverage to call a mutation confidently. Only the well-covered, reliably genotyped positions count. In practice, researchers define callable sites with a depth filter, keeping positions where the child's coverage is neither too low nor suspiciously high relative to the trio. Getting C right is as important as counting D, because the rate is their ratio.
Worked Example: A Trio Calculation
Put numbers to it. Suppose sequencing a trio turns up 70 high-confidence de novo single-nucleotide mutations in the child, and the callable portion of the genome, where mutations could reliably be detected, totals 2.8 billion sites.
Apply the formula. The rate is 70 divided by twice 2.8 billion, which is 70 divided by 5.6 billion. That works out to 1.25 x 10^-8 per base pair per generation. This matches the accepted human germline rate, which is the point of the example: the procedure reproduces the known figure from a single trio's counts.
Two corrections refine a real estimate. First, the false-positive rate: some candidate de novo mutations are sequencing artifacts, so the raw count D is adjusted downward by the estimated fraction of false calls. Second, the false-negative rate: some true mutations are missed, so the count is adjusted upward, or equivalently the callable-site count is adjusted, to reflect detection power. After both corrections, the estimate stabilizes near the true rate. You can run the per-site arithmetic for any counts of mutations and sites by dividing the mutation count by twice the callable sites in a calculator, which handles the factor of two for you.
The Indirect Method: Divergence Over Time
The indirect method, also called the phylogenetic or substitution method, estimates the rate from how much two species' genomes have diverged since they shared a common ancestor. It was the only option before sequencing whole families became feasible.
The logic runs backward through time. Two species that split from a common ancestor have each been accumulating mutations independently ever since. The genetic differences between them today are the sum of the changes along both lineages. If you know how different they are and how long ago they split, you can calculate the rate at which differences accumulated.
This method gives a long-term average rate, smoothed over millions of years, rather than the current per-generation rate. It is indispensable for species that cannot be bred and sequenced in pedigrees, and it underlies the molecular clock used to date evolutionary splits. Its weakness is that it depends on knowing the divergence time, usually from fossils, which carries its own uncertainty. It also depends on the ancestral population size, because two species' divergence includes variation that was already present in their common ancestor, a quantity tied to the effective population size of that ancestor.
The Phylogenetic Formula
The phylogenetic rate divides the sequence divergence between two species by twice the time since they split. The factor of two appears again, for a different reason this time:
µ = D / (2T)
Here D is the proportion of sites that differ between the two species, and T is the time since their common ancestor. The factor of two is because both lineages have been accumulating mutations independently since the split, so the total divergence reflects two separate evolutionary paths of length T, not one. Divide by 2T to get the rate per lineage per unit time.
The unit of T sets the unit of the rate. If T is in years, the rate comes out per year; if in generations, per generation. The phylogenetic method most naturally gives a per-year rate, which is why molecular evolution often works in per-year terms, while the trio method gives a per-generation rate. Converting between them requires the generation time, a frequent source of confusion when comparing the two methods.
Worked Example: A Phylogenetic Calculation
Use humans and chimpanzees, the classic case. Their genomes differ at roughly 1.2 percent of sites, so D is about 0.012. They split from a common ancestor roughly 6.5 million years ago, so T is about 6.5 million years.
Apply the formula. The rate is 0.012 divided by twice 6.5 million, which is 0.012 divided by 13 million years. That gives about 0.9 x 10^-9 per site per year. This is close to the often-quoted phylogenetic rate of roughly 1 x 10^-9 per site per year for primates.
Now convert to a per-generation rate to compare with the trio method. Multiply the per-year rate by the generation time. At a human generation time of about 25 to 30 years, 0.9 x 10^-9 per year times 25 to 30 gives roughly 2.3 to 2.7 x 10^-8 per generation. Notice this is about double the direct trio estimate of 1.2 x 10^-8. That gap is real and important, the subject of the next section.
Why the Two Methods Disagree
The direct and indirect methods often produce different rates, and the discrepancy is one of the live puzzles in the field. Recognizing why matters for using either number correctly.
The phylogenetic per-generation rate often comes out higher than the direct trio rate, sometimes nearly double, as the worked examples showed. Several factors contribute. Generation times have changed over evolutionary history, so assuming a constant present-day generation time when converting the long-term rate introduces error. Divergence times from fossils are uncertain, and a different assumed split time shifts the phylogenetic rate directly. And the per-year mutation rate itself may not have been constant across millions of years, violating the assumption the phylogenetic method rests on.
The direct method has its own uncertainties, dominated by filtering choices. How strictly you filter candidate mutations changes the count substantially: one primate study found that varying a single quality threshold shifted the estimate from below 0.7 x 10^-8 to above 1.1 x 10^-8 per base per generation.
The discrepancy has a name in human evolution: the mutation rate slowdown puzzle. When the lower, direct per-generation rate is used to date events like the human-chimp split or human migrations, the dates come out substantially older than fossil and archaeological evidence suggested under the older, higher phylogenetic rate. Reconciling the two has forced a rethink of either the divergence dates, the constancy of the rate, or how generation times have changed over millions of years. The debate is unresolved, and it matters well beyond mutation rates, because the molecular clock calibrated by these numbers underpins the entire timeline of human and primate evolution. So neither method is a clean ground truth. The direct method gives the best current per-generation rate; the phylogenetic method gives the best long-term average; and the gap between them, when converted to the same units, is itself informative about how generation time and the rate have changed. This tension is closely tied to the difference between a mutation rate and a substitution rate, two quantities that are easy to conflate.
Other Ways to Measure
Beyond trios and phylogenetics, a few other approaches suit particular organisms. They share the same goal of counting changes against an opportunity denominator.
Mutation accumulation lines are used in model organisms like flies, worms, and bacteria. Researchers propagate lines through repeated single-individual bottlenecks for many generations, which lets even slightly harmful mutations accumulate nearly free of selection, then sequence the lines and divide the accumulated mutations by the number of generations and sites. This is a controlled, experimental version of the direct method.
Reporter-gene assays measure the rate at a specific locus by counting how often a gene loses or changes function, classically in bacteria. The fluctuation test of Luria and Delbrück, a landmark method, estimates microbial mutation rates from the variance in mutant counts across parallel cultures. These locus-specific methods predate whole-genome sequencing and remain useful for microbes, though they measure a single gene's rate rather than the genome-wide average.
Worked Example: Mutation Accumulation
Mutation accumulation lines suit organisms with short generations, and their calculation shows the same ratio logic in a different setup. Suppose a researcher propagates fruit fly lines for 200 generations through single-pair bottlenecks, sequences them, and finds an average of 16 accumulated mutations per line across 130 million callable sites.
The per-generation rate is the accumulated mutations divided by the product of generations and callable sites, again accounting for diploidy. That is 16 divided by 200 generations times twice 130 million sites. The denominator is 200 times 260 million, which is 52 billion, so the rate is 16 divided by 52 billion, about 3.1 x 10^-10 per site per generation. The repeated bottlenecks are what make this work: by passing each line through one or a few individuals every generation, selection has almost no chance to remove mildly harmful mutations, so they accumulate at nearly the raw mutation rate.
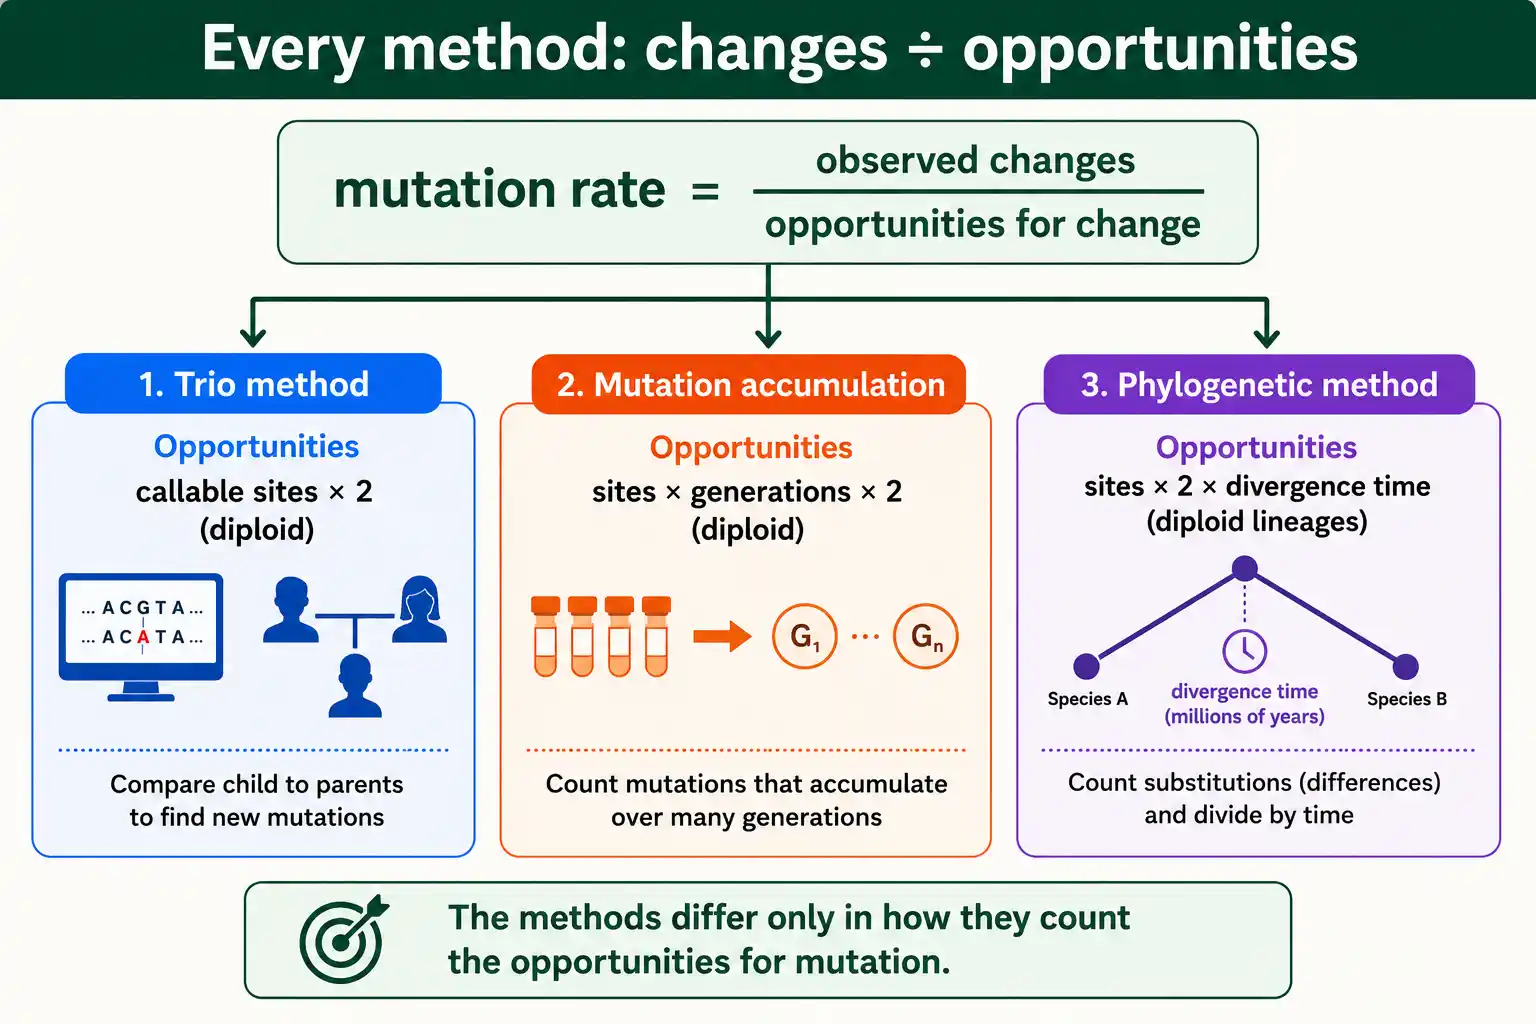
The trick and the limitation are the same. Mutation accumulation measures the rate nearly free of selection, which is exactly what you want, but only lethal mutations are still removed, so the estimate is the rate of all viable mutations. For organisms that cannot be propagated this way, including humans, the trio method is the direct alternative. The shared structure across all these methods is worth seeing: every one divides observed changes by the opportunities for change, whether opportunities are counted as callable sites in one generation, sites times generations in accumulation lines, or sites times divergence time in phylogenetics.
Common Calculation Errors
A few mistakes recur in mutation-rate estimation. Knowing them protects any calculation.
The first is forgetting the factor of two. Whether from the two genome copies of a diploid offspring or the two lineages since a species split, the factor of two belongs in the denominator. Leaving it out doubles the estimate, a surprisingly common slip.
The second is using the wrong denominator. The denominator is callable sites, not the whole genome. Positions with poor coverage cannot yield reliable mutation calls, so including them inflates the denominator and understates the rate. The callable-site count must reflect where mutations could actually have been detected, not the genome's full size.
The third is mismatching units when comparing methods. A per-year phylogenetic rate and a per-generation trio rate are not directly comparable until one is converted using the generation time. Comparing them raw makes the methods look more discordant than they are. Always convert to common units before drawing conclusions about whether two estimates agree.
The fourth is ignoring the false-positive and false-negative corrections. Raw de novo counts include sequencing artifacts and miss real mutations, so an uncorrected count gives a biased rate. Serious estimates validate a sample of candidates and adjust for both error types, which is why the same raw data can yield different published rates depending on the pipeline.
Frequently Asked Questions
What is the formula for mutation rate?
For the direct trio method, the per-generation rate is the number of de novo mutations divided by twice the number of callable sites: µ = D / (2C). For the phylogenetic method, the rate is the divergence between two species divided by twice the time since they split: µ = D / (2T). Both include a factor of two, for the two genome copies in a diploid offspring and the two lineages since a species split, respectively.
Why divide by two when calculating mutation rate?
In the trio method, a diploid child carries two genome copies, one from each parent, so each callable site offers two chances for a mutation to occur and be detected. In the phylogenetic method, both species' lineages have accumulated mutations independently since their split, so the divergence reflects two evolutionary paths. Dividing by two in each case gives the per-copy or per-lineage rate.
Which method is more accurate?
The direct trio method gives the best estimate of the current per-generation mutation rate, because it measures mutations directly in one generation. The phylogenetic method gives a long-term average over millions of years and is the only option for species that cannot be sequenced in families. The two can differ substantially, mainly because of uncertain divergence times and changing generation times.
From Counts to a Rate
Calculating a mutation rate comes down to a ratio: changes observed, divided by the opportunities for change. The direct trio method counts de novo mutations in a child and divides by twice the callable sites, giving the current per-generation rate of about 1.2 x 10^-8 in humans. The phylogenetic method divides species divergence by twice the time since they split, giving a long-term per-year rate of roughly 1 x 10^-9 for primates.
Both carry a factor of two, for two genome copies or two lineages, and both demand care with their denominators: callable sites for trios, divergence time for phylogenetics. The two methods can disagree by roughly twofold once converted to the same units, which reflects real uncertainty about generation times and rate constancy rather than a simple error. To understand that disagreement fully, our guide on mutation rate versus substitution rate untangles the two quantities the methods are really measuring.