IB Biology Genetics: Punnett Squares & Crosses
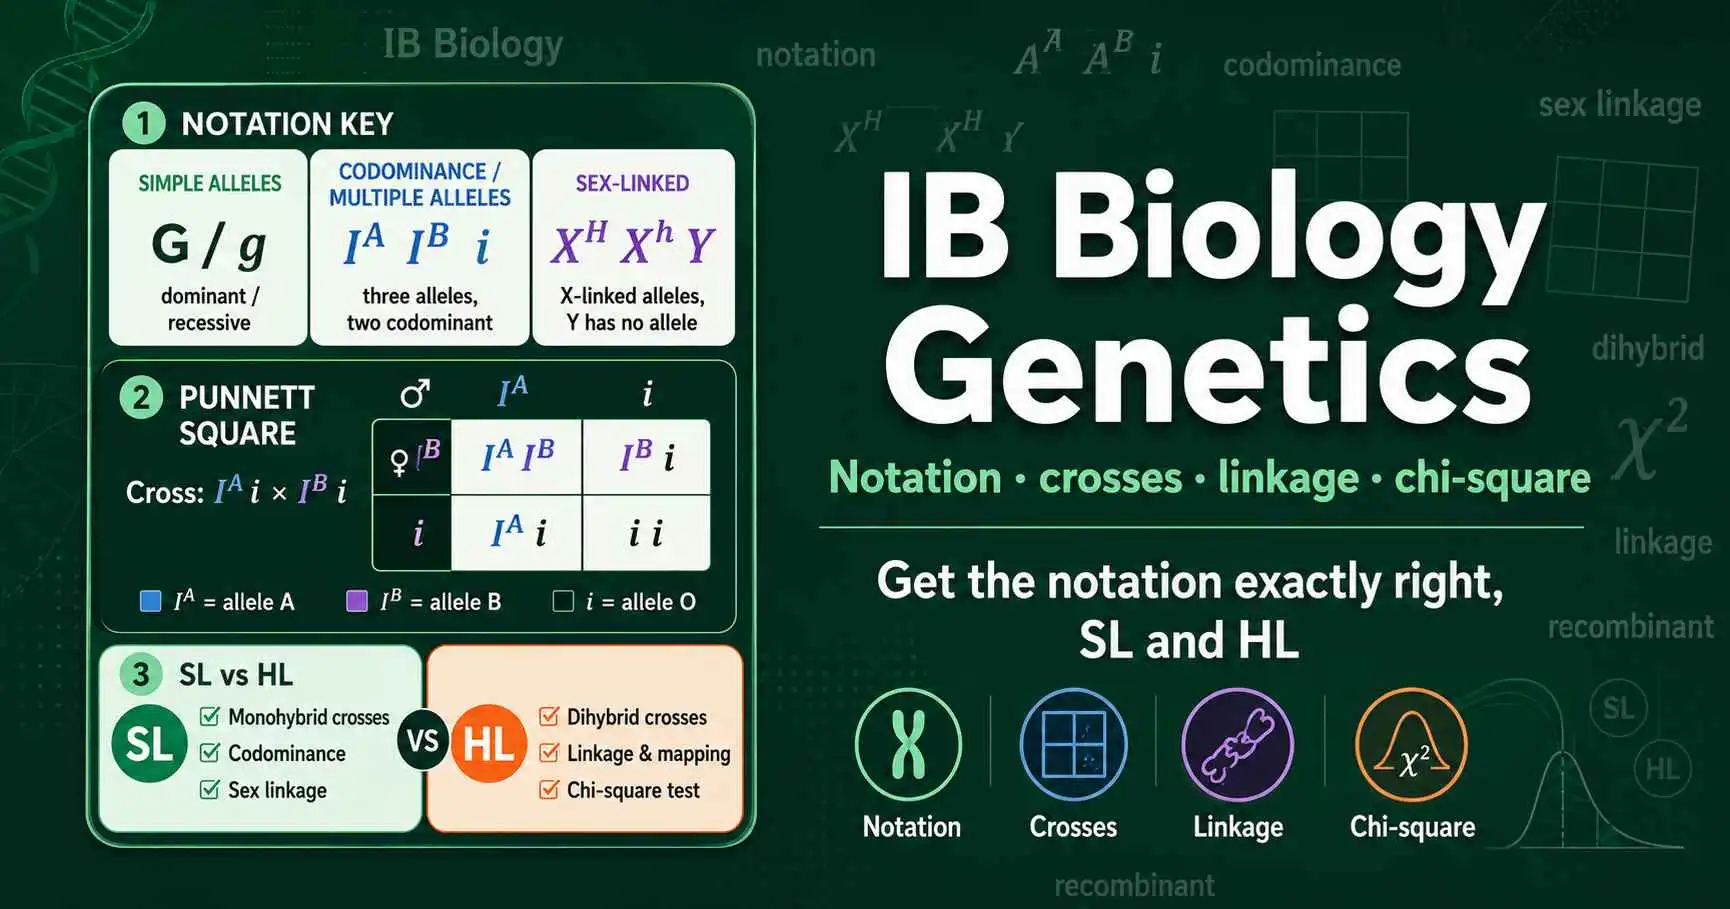
IB Biology genetics expects you to construct and interpret Punnett squares using the precise notation the syllabus requires, then apply them to monohybrid crosses, codominance, multiple alleles, and sex linkage. Higher Level students go further into dihybrid crosses, gene linkage, recombinants, and the chi-square test. Getting the notation exactly right, and knowing which patterns belong to Standard Level versus Higher Level, is what earns marks in IB exams and internal assessments.
This guide is written for IB Biology students following the current syllabus, covering both Standard and Higher Level requirements. It walks through the correct allele notation, the step-by-step cross method examiners expect, the inheritance patterns the IB requires, and the statistical analysis Higher Level demands. Precision matters more in IB than in many courses, so the focus throughout is on getting the details right. For the underlying mechanics of any cross, our guide on how a Punnett square works provides the foundation.
Getting the Notation Right: An IB Priority
The IB places unusual emphasis on correct genetic notation, and using it precisely is one of the easiest ways to secure marks. Examiners deduct credit for sloppy or inconsistent symbols, so learning the conventions early pays off across every genetics question.
For a standard dominant-recessive trait, the rule is simple: use a capital letter for the dominant allele and the same letter in lowercase for the recessive allele, such as G for green and g for yellow. The two letters must be clearly distinguishable, which is why examiners advise choosing letters whose capital and lowercase forms look different, avoiding letters like C, S, and O where the two cases are hard to tell apart. This small choice prevents your work from being misread.
The conventions change for more complex patterns, and this is where IB students often lose marks. For codominance and multiple alleles, the IB convention is to use a common base letter with superscripts for each allele, so the ABO blood group alleles are written as I with superscript A, I with superscript B, and a lowercase i. For sex-linked traits, you write the alleles as superscripts on an uppercase X, such as X with a superscript H for the normal allele and X with a superscript h for a recessive condition, while the Y chromosome carries no superscript. Using the right notation for each pattern signals to the examiner that you understand the underlying genetics, and it is a genuine, recoverable source of marks.
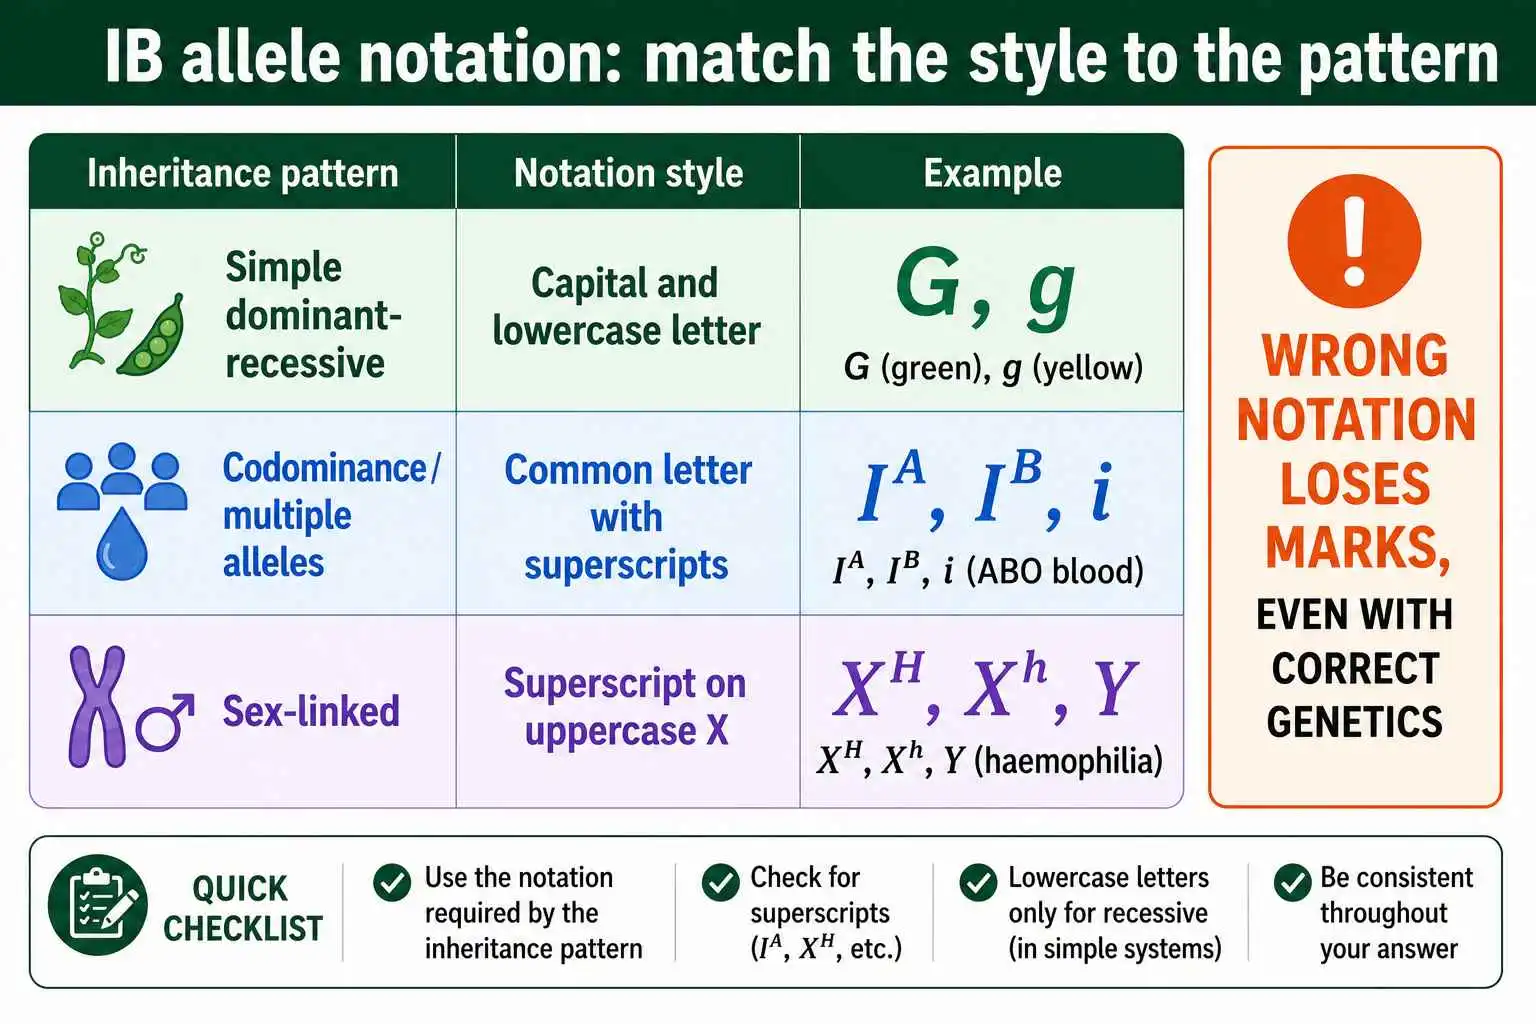
The table below summarises the IB notation conventions you should commit to memory, since each inheritance pattern uses a different style.
| Inheritance pattern | Notation style | Example |
|---|---|---|
| Simple dominant-recessive | Capital and lowercase letter | G and g |
| Codominance / multiple alleles | Common letter with superscripts | IA, IB, i |
| Sex-linked | Superscript on uppercase X | XH, Xh, Y |
Each style carries meaning. The capital-and-lowercase pair signals a clear dominant and recessive relationship. The superscript style for codominance shows that the alleles are equal partners with no single dominant letter, which is why a plain capital-and-lowercase pair would be wrong for blood groups. The uppercase-X superscript makes the sex chromosome explicit, so the sex of each offspring is built into the genotype. Matching the notation to the pattern is not a formality; it encodes the genetics, and examiners read it as evidence that you understand what you are doing.
The IB Method for Constructing a Cross
The IB expects a clear, structured approach to every genetic cross, and following the prescribed steps ensures you show all your working. Genetics questions reward method, so laying out each stage is as important as the final ratio.
Use these steps every time. First, designate the alleles with the correct notation for the type of trait. Second, write down the genotype and phenotype of both parents, the P generation. Third, determine the gametes each parent can produce, remembering that gametes are haploid and carry only one allele per gene. Fourth, draw a Punnett grid with one parent's gametes along the top and the other's down the side, then combine them to fill the boxes. Fifth, state the genotype and phenotype ratios of the offspring, the F1 generation, and continue to the F2 generation if the question requires interbreeding.
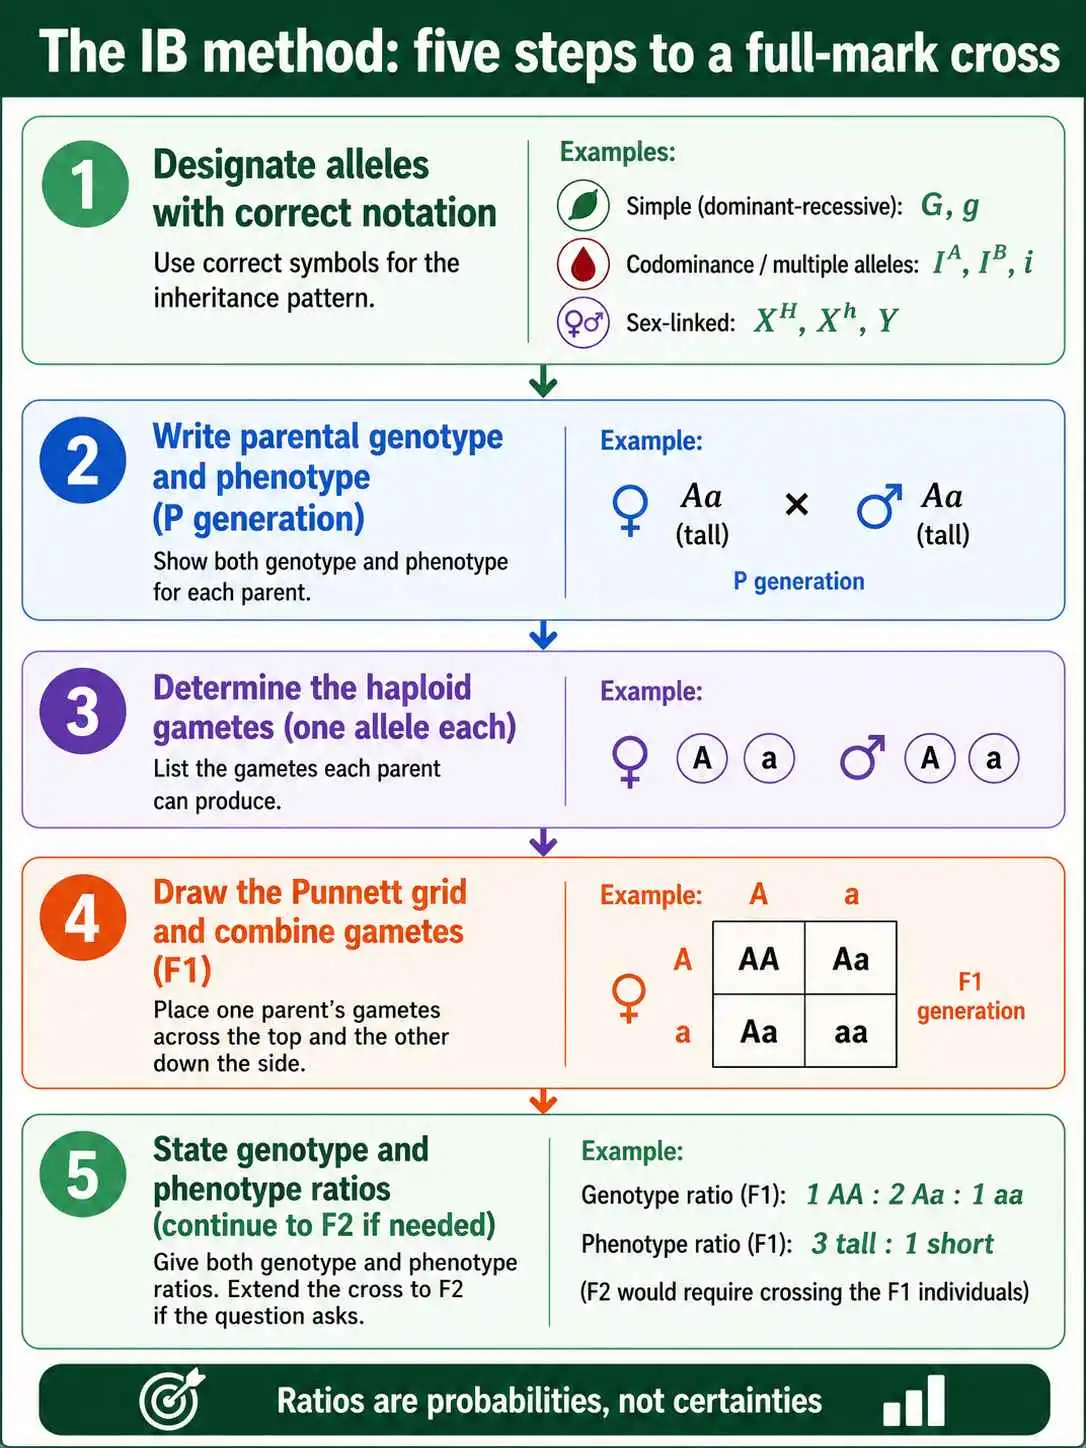
A point the IB stresses is that the ratios are probabilities, not certainties. A predicted 3:1 ratio describes the likelihood of each outcome across many offspring, not a guarantee for any small number of them. Examiners may ask you to state this explicitly, so it is worth including. Labelling each generation as P, F1, and F2 also matters, since IB questions frequently ask you to work through two generations, crossing the F1 offspring to produce the F2. You can verify any cross while you study with a calculator that keeps the notation and ratios organised.
Monohybrid Crosses and Standard Level Patterns
At Standard Level, the IB requires you to handle monohybrid crosses for a single gene, including the non-Mendelian patterns of codominance and multiple alleles. The monohybrid cross is the foundation, and the same five-step method applies throughout.
A basic monohybrid cross between two heterozygotes gives the familiar 3:1 phenotypic ratio and 1:2:1 genotypic ratio. The IB then extends this to codominance, where both alleles are fully expressed in the heterozygote rather than one masking the other. The required example is human ABO blood groups, which conveniently combines codominance with multiple alleles. The IA and IB alleles are codominant with each other, producing type AB blood when both are present, while both are dominant over the recessive i allele.
The IB also expects you to know incomplete dominance, where the heterozygote shows an intermediate, blended phenotype. The syllabus-favoured example is the four o'clock flower, and using its scientific name, Mirabilis jalapa, can gain credit in an exam. A cross between red and white four o'clock flowers gives pink heterozygotes, and crossing two pink plants yields a 1:2:1 ratio of red to pink to white. Knowing these specific examples, with their correct names and notation, is exactly the kind of detail IB rewards, and it distinguishes a thorough answer from a vague one.
A worked ABO example shows the notation in action. Suppose a heterozygous type A parent, genotype I with superscript A paired with i, has children with a type AB parent, genotype I with superscript A and I with superscript B. The type A parent produces two gametes, one carrying the IA allele and one carrying the i allele. The type AB parent also produces two gametes, one IA and one IB. Combining these in a Punnett square gives four offspring genotypes: one with two IA alleles (type A), one with IA and IB (type AB), one with IA and i (type A), and one with IB and i (type B). So the phenotype ratio is two type A to one type AB to one type B, with no type O possible because neither parent carries two i alleles. Writing every allele with its correct superscript throughout is what secures the marks on a question like this.
Sex Linkage in IB Biology
Sex linkage is a required topic at both levels, and the IB has specific expectations for how you handle the notation and predict outcomes. Sex-linked genes sit on the X chromosome, so their inheritance is tied to the sex of the offspring, producing the characteristic patterns the IB tests.
The notation is the part students most often get wrong. You must write sex-linked alleles as superscripts on an uppercase X, never as plain letters. So for haemophilia, an X-linked recessive disorder caused by a deficiency in a blood clotting factor, you write the normal allele as X with a superscript H and the affected allele as X with a superscript h. The Y chromosome is written plainly, carrying no allele for the gene. This notation makes the sex of each offspring visible in the genotype, which is essential for reading the cross correctly.
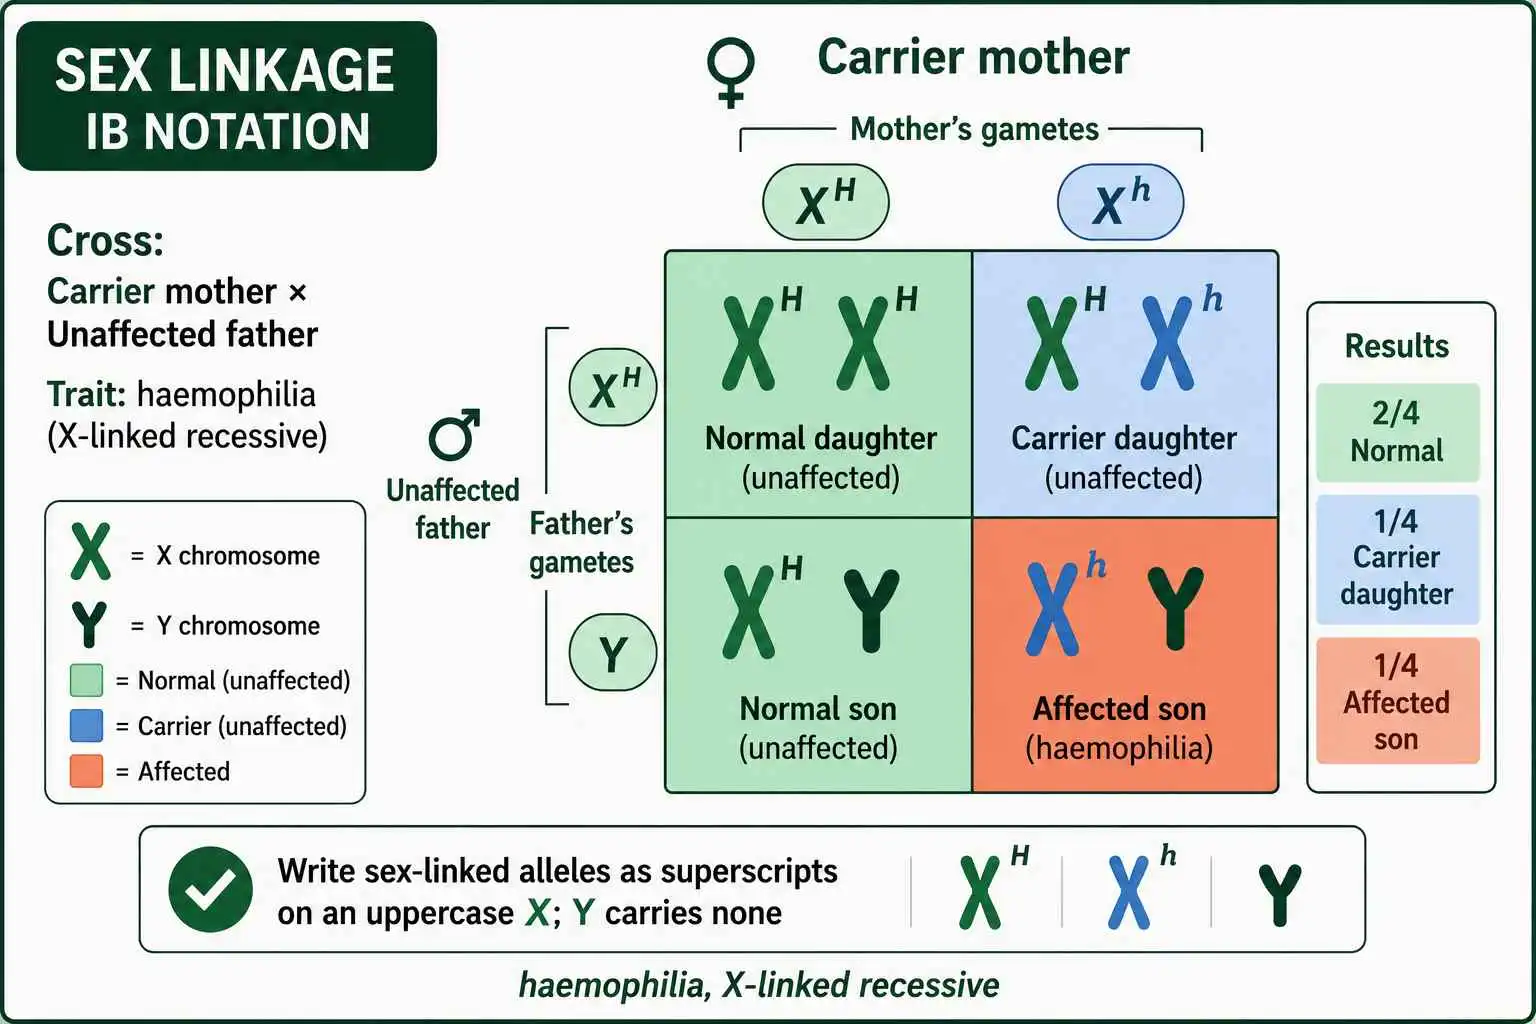
The classic IB cross is a carrier mother with an unaffected father, which shows why X-linked recessive conditions appear more often in males. Because a male has only one X chromosome, a single recessive allele on it is expressed, while a female would need the allele on both X chromosomes to be affected. Reading sons and daughters separately is essential, since their outcomes differ. The IB may also ask you to interpret a pedigree showing a sex-linked condition, applying the same notation and logic to a family tree.
Higher Level: Dihybrid Crosses
Higher Level students must extend Punnett squares to dihybrid crosses, tracking two genes at once. This is one of the main HL additions, and it builds directly on the monohybrid method with a larger grid.
A dihybrid cross between two double-heterozygotes, such as AaBb crossed with AaBb, requires each parent to produce four types of gamete. The reliable way to find them is the FOIL method, taking one allele from each gene in every combination to give AB, Ab, aB, and ab. These four gametes go on each axis of a 4x4 Punnett square with sixteen boxes. The IB specifies that this applies to unlinked autosomal genes, meaning the two genes sit on different chromosomes and assort independently.
The expected outcome is the 9:3:3:1 phenotypic ratio, the cornerstone result for two unlinked genes showing complete dominance. The IB expects you to calculate the predicted genotypic and phenotypic ratios for both F1 and F2 offspring of such crosses. A common HL exam scenario uses an organism like sheep, where one gene controls wool colour and another controls a separate trait, asking you to predict the offspring ratios. Mastering the dihybrid cross is essential for HL, because the next topics, linkage and the chi-square test, depend on understanding what the unlinked 9:3:3:1 ratio should look like before you can recognise a deviation from it.
Higher Level: Gene Linkage and Recombinants
Gene linkage is a distinctly Higher Level topic, and it explains why some dihybrid crosses deviate from the expected 9:3:3:1 ratio. The IB requires you to understand linked genes, recombinants, and the role of crossing over, which together form one of the more conceptually demanding parts of the syllabus.
Linked genes are genes whose loci lie close together on the same chromosome, so they tend to be inherited together rather than assorting independently. This breaks Mendel's law of independent assortment, and as a result the phenotypic ratio shifts away from 9:3:3:1, often resembling a monohybrid ratio because the two genes travel as a single unit. The IB asks you to use correct notation for linked genes and to construct a Punnett square showing the possible outcomes when genes are linked, which looks different from the unlinked case.
Recombinants are the key concept layered on top. During meiosis, crossing over between homologous chromosomes can separate linked genes, producing allele combinations not present in the parents. These new combinations are called recombinants, and they appear at lower frequencies than the parental types. The IB connects this to the history of genetics through Thomas Hunt Morgan, who discovered linkage in fruit flies and used recombination frequencies to map gene positions on chromosomes. Understanding that recombinants arise from crossing over, and that their frequency reflects the distance between genes, is exactly the depth HL expects. To model crosses where genes are linked, the genetic linkage calculator handles the modified ratios.
The relationship between recombination frequency and gene distance is worth understanding precisely, since the IB connects it to gene mapping. The further apart two linked genes lie on a chromosome, the more often crossing over occurs between them, so the higher the proportion of recombinant offspring. Genes very close together rarely recombine and are almost always inherited as a pair, while genes far apart on the same chromosome can recombine often enough to appear almost unlinked. Morgan and his students used this insight to build the first chromosome maps, treating one percent recombination frequency as one map unit of distance. The IB does not always require the full mapping calculation, but understanding that recombination frequency is a measurable proxy for physical distance between genes is the conceptual core of why linkage matters, and it shows the examiner you grasp the link between meiosis and inheritance patterns.
Pedigree Charts in IB Biology
Alongside Punnett squares, the IB requires you to interpret pedigree charts, which trace a trait through several generations of a family. This is a closely linked skill, and the same understanding of dominant, recessive, and sex-linked inheritance lets you read one with confidence.
In a pedigree, circles represent females and squares represent males, with shaded shapes indicating individuals who show the trait and unshaded shapes indicating those who do not. Horizontal lines connect mating partners, and vertical lines link parents to their offspring. The IB expects you to deduce the mode of inheritance from the pattern, determine the genotypes of specific individuals, and sometimes calculate the probability that a future child will be affected. For instance, two unaffected parents who produce an affected child reveal a recessive trait, since both parents must be carriers, the same logic that underlies recessive disorders in a Punnett square.
Sex-linked conditions show a distinctive pedigree signature that the IB tests directly. An X-linked recessive condition affects far more males than females and tends to pass from an affected grandfather through an unaffected carrier daughter to an affected grandson, appearing to skip a generation. Recognising this pattern, and applying the correct uppercase-X notation when you work out genotypes from the pedigree, demonstrates the integrated understanding IB examiners look for. Pedigree questions often combine with a Punnett square, asking you to read genotypes from the family tree and then predict the next generation, so practising the two diagram types together is strong preparation.
Higher Level: The Chi-Square Test
The current IB syllabus requires Higher Level students to apply the chi-square test to genetic crosses, particularly to determine whether genes are linked. This statistical component connects the Punnett square prediction to real experimental data, and it is explicitly examinable.
The IB expects you to understand the concept of statistical significance, the p equals 0.05 level, the null and alternative hypotheses, and the idea of comparing observed results against expected ones. The logic is that a Punnett square predicts an expected ratio, such as 9:3:3:1 for unlinked genes, and the chi-square test checks whether your observed data fit that prediction closely enough to be due to chance. The formula sums the squared difference between observed and expected, divided by expected, across all categories.
The specific IB application is testing for linkage. In a dihybrid cross where you do not know whether the genes are linked, you use the chi-square test to determine whether the observed genotype frequencies differ significantly from the Mendelian 9:3:3:1 prediction. If the chi-square value exceeds the critical value at p equals 0.05, you reject the null hypothesis, concluding that the observed results differ significantly from independent assortment, which suggests the genes are linked. If it does not exceed the critical value, the data are consistent with unlinked genes. This turns the chi-square test into a tool for discovering linkage, and our chi-square calculator computes the statistic from your observed and expected counts. Always finish by stating what the result means biologically, since IB rewards that interpretation. The official subject guidance, summarised in the IB Biology syllabus overview, confirms that this statistical reasoning is now a core part of the Higher Level genetics requirement.
Frequently Asked Questions
How do you write sex-linked alleles in IB Biology?
Write sex-linked alleles as superscripts on an uppercase X, such as X with a superscript H for a normal allele and X with a superscript h for a recessive condition. The Y chromosome is written plainly with no allele, since the gene is on the X chromosome only.
What is the difference between IB Standard Level and Higher Level genetics?
Standard Level covers monohybrid crosses, codominance, multiple alleles, and sex linkage. Higher Level adds dihybrid crosses, gene linkage, recombinants from crossing over, and the chi-square test for determining whether genes are linked.
How do you show codominant alleles in IB notation?
Use a common base letter with superscripts for each allele. For ABO blood groups, the codominant alleles are written as I with superscript A and I with superscript B, while the recessive allele is a lowercase i. This convention distinguishes codominance from simple dominance.
Why does the IB use the chi-square test for genetics?
The chi-square test compares observed cross results against the ratio a Punnett square predicts, such as 9:3:3:1. At Higher Level, it is used to test for gene linkage: a significant deviation from the expected ratio suggests the genes are linked rather than assorting independently.
Exam and IA Preparation
IB Biology genetics rewards precision above all. Use the correct notation for each pattern, capital and lowercase letters for simple traits, superscripts for codominance and multiple alleles, and superscripts on an uppercase X for sex linkage. Follow the structured cross method, label your P, F1, and F2 generations, and remember that ratios are probabilities. Know which patterns belong to Standard Level and which extend into Higher Level, since the dihybrid cross, linkage, recombinants, and the chi-square test are all HL material.
For Higher Level especially, understand how linkage breaks the 9:3:3:1 ratio and how the chi-square test detects it, always connecting your statistical result back to the biology. These skills also support the internal assessment, where a genetics investigation might call for exactly this analysis, particularly the chi-square testing of observed against expected ratios. You can construct and check any cross while you prepare with the Punnett Square Calculator, which handles the notation and ratios so you can focus on the reasoning. For syllabus-aligned revision notes, the BioNinja IB Biology resource is a trusted reference to work through as you consolidate each pattern before the exam.