What Is the Inbreeding Coefficient? (F Explained)
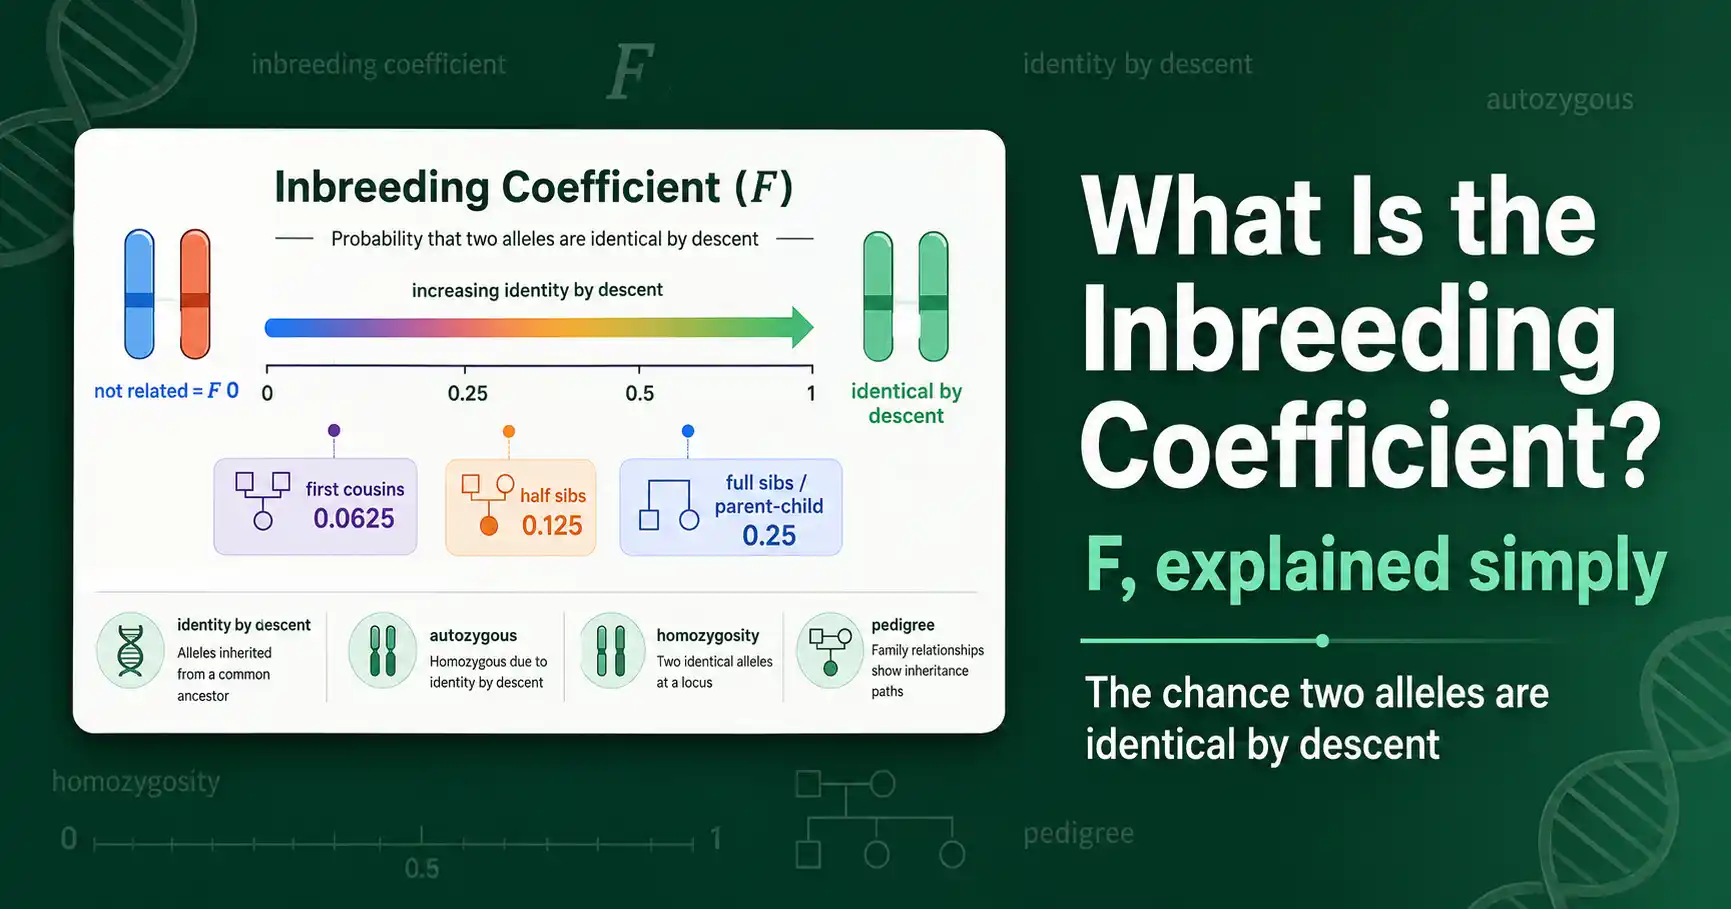
The inbreeding coefficient, written F, is the probability that the two alleles at a gene in an individual are identical by descent. Identical by descent means both copies are inherited from the same ancestral copy in a shared ancestor. F runs from 0 to 1. A value of 0 means no inbreeding. A value of 1 means the two alleles are certainly identical by descent.
That single number captures how inbred an individual is. The higher the F, the more closely related the individual's parents are, and the more likely it is to carry two identical copies of a gene. This guide explains what F measures, the two ways it is defined, how to read its values, and why it matters for health and breeding.
The Core Definition
F is a probability. Pick the two alleles an individual carries at any gene. F is the chance those two alleles trace back to a single copy in a common ancestor.
When parents are unrelated, their alleles come from separate ancestral lines, so the chance of inheriting two copies of the same ancestral allele is effectively zero. F is 0. When parents share a recent ancestor, both can pass down copies of that ancestor's allele, so their child can inherit the same allele twice. F rises above 0. The closer the relationship, the higher the F.
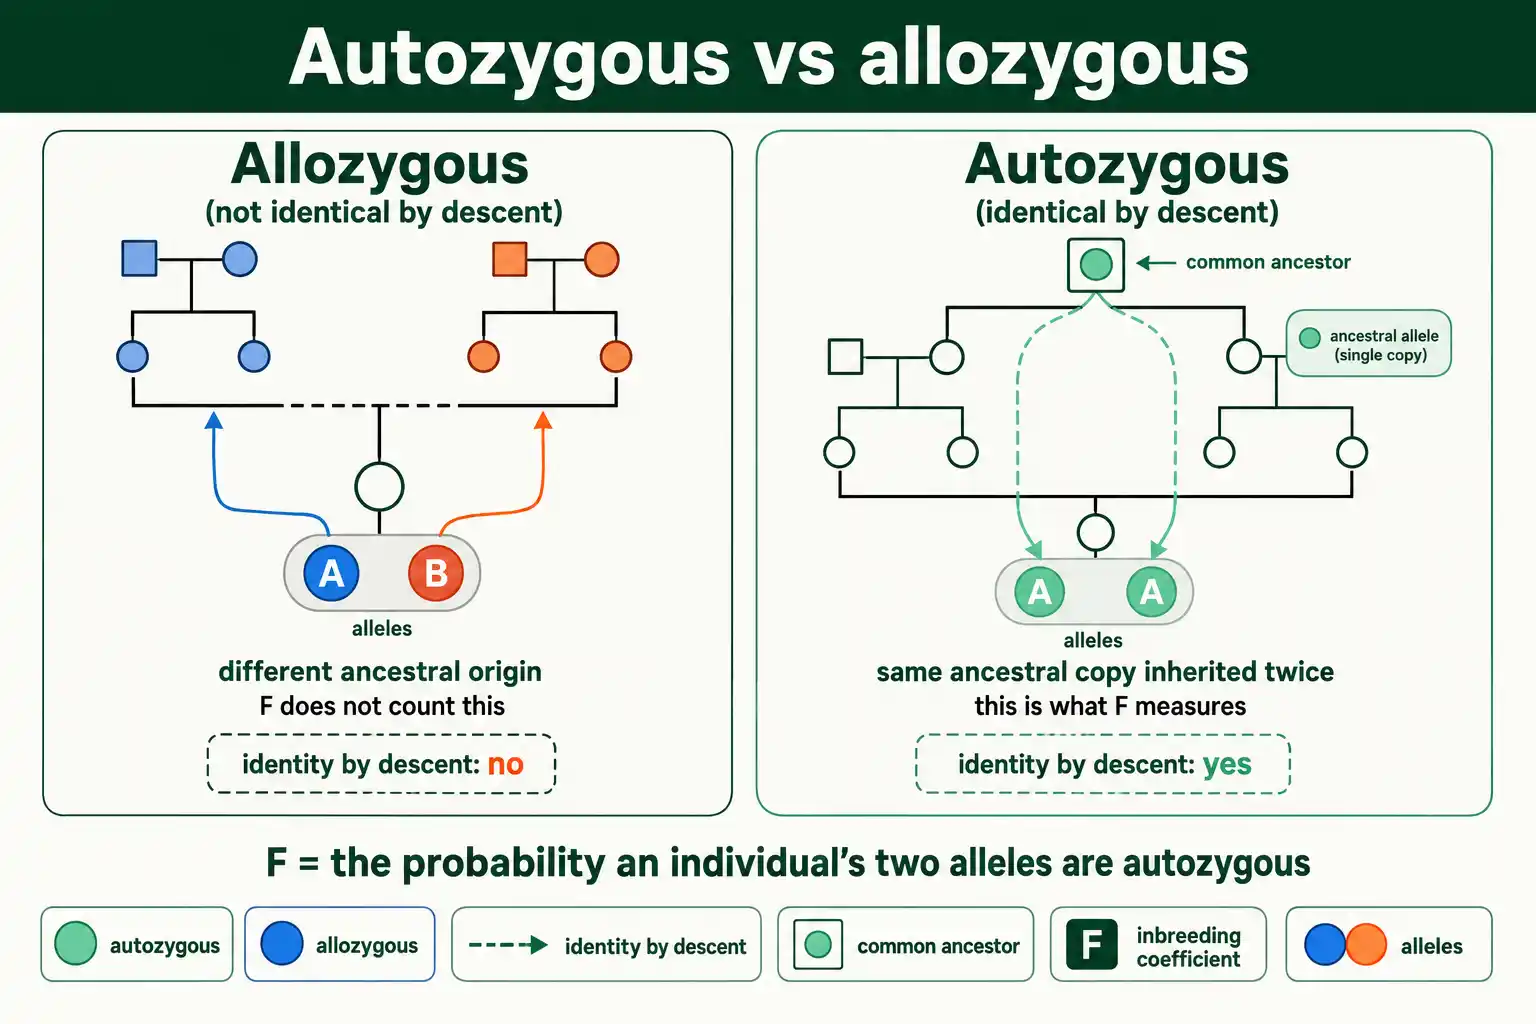
Two terms make this precise. Alleles that are identical by descent are called autozygous. Alleles that are not are called allozygous. F is simply the probability that an individual is autozygous at a random gene. This framing comes from Gustave Malécot, who in 1948 defined F as the probability of identity by descent, the version used in nearly all pedigree work today.
Sewall Wright introduced the coefficient earlier, in 1922, with a slightly different definition: the correlation between the two uniting gametes that form an individual. The two definitions describe the same quantity. Wright's correlation framing and Malécot's probability framing converge on the same F, which is why both names attach to the concept.
Two Ways to Define F
F has two equivalent definitions, and seeing both makes it click. They give the same number from different angles.
The first is the one above: F is the probability that an individual's two alleles are identical by descent. This is the pedigree definition, computed from family trees.
The second is about heterozygosity. F is the proportional drop in heterozygosity compared to a randomly mating population. Inbreeding makes individuals more homozygous, so a population with inbreeding has fewer heterozygotes than Hardy-Weinberg predicts. The formula is direct:
F = (He − Ho) / He
Here He is the expected heterozygosity under random mating, which for two alleles is 2pq, and Ho is the heterozygosity actually observed. If observed heterozygosity matches the expectation, F is 0. As observed heterozygosity falls below expectation, F climbs. This version, laid out in Daniel Hartl and Andrew Clark's standard text Principles of Population Genetics and detailed in this overview of the inbreeding coefficient, is how F gets measured from genetic marker data rather than pedigrees.
Both definitions matter. The pedigree version predicts F from known ancestry. The heterozygosity version measures F from real genotypes. They should agree, and when they do not, the gap itself is informative.
What the Numbers Mean
F values map onto specific relationships between parents. A few reference points anchor the scale.
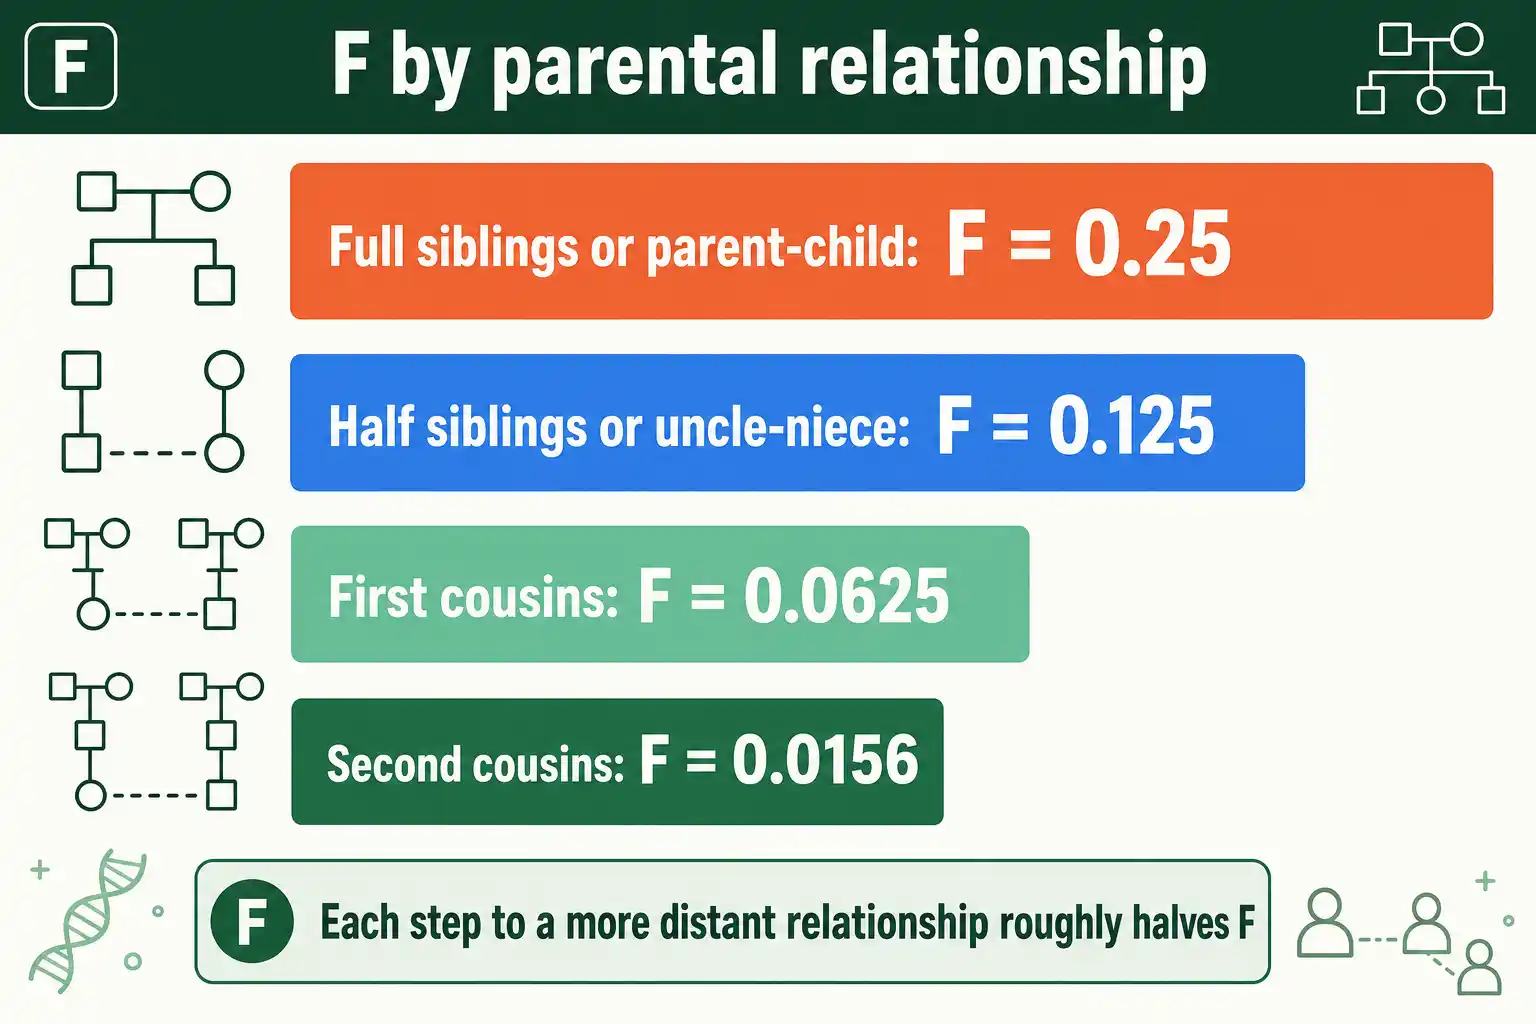
The offspring of full siblings, or of a parent and child, have an F of 0.25. The offspring of half siblings, or of an uncle and niece, have an F of 0.125. The offspring of first cousins have an F of 0.0625. The offspring of second cousins have an F of about 0.0156. Each step to a more distant relationship roughly halves F.
These come from a simple rule. Each generation of separation between the parents through a common ancestor cuts the shared-allele probability in half, because each meiosis passes a given allele with probability one-half. You can confirm any of these by tracing the paths through a pedigree, or check them instantly with an inbreeding coefficient calculator that does the path-counting for you.
One caution. F is always relative to a base population assumed to have F of 0. It measures the increase in homozygosity from recent shared ancestry, not the total. Go back far enough and everyone shares ancestors, so the choice of base population sets what F is measuring against.
Why F Matters
Inbreeding raises homozygosity, and that is the whole reason F matters. The consequences follow directly.
Most harmful alleles are recessive. They cause problems only when an individual carries two copies, the homozygous state. In an outbred individual, a single harmful recessive is usually masked by a normal allele. Inbreeding changes the odds. When parents share ancestry, their child is more likely to inherit two copies of the same recessive allele, including harmful ones. This is why inbreeding raises the risk of recessive genetic disorders.
The effect is measurable and large for close matings. First-cousin marriage roughly doubles the baseline risk of serious recessive conditions in offspring, and closer matings raise it far more. The pattern holds across species, which is why it shapes both human genetics and animal breeding.
At the population level, sustained inbreeding lowers average fitness, a phenomenon called inbreeding depression. Reduced fertility, weaker immunity, higher mortality in the young, and developmental problems all track rising F. The reduction in heterozygosity that F measures is, in a real sense, a reduction in the genetic diversity an individual or population has to work with.
F and Genetic Drift
F connects to genetic drift, which surprises people at first. In a small population, drift and inbreeding are two views of the same process.
Here is the link. In a small population, individuals are forced to mate with relatives simply because the pool of partners is limited. Even random mating in a small population is, in effect, inbreeding, because everyone is related. The expected inbreeding from finite population size rises each generation at a rate of 1 divided by twice the population size, the same 1/(2N) term that governs the loss of heterozygosity through drift.
This is not a coincidence. Drift erodes heterozygosity by randomly sampling alleles, and that sampling raises the chance of pairing identical-by-descent copies. So F, defined through identity by descent, and drift, defined through random sampling, describe one underlying reality from two directions. This is the bridge between the inbreeding of individuals and the population genetics of small groups, explored further in our guide on the effective population size.
It also explains a phrase you will see often: inbreeding is unavoidable in any finite population over time. Even with careful mate choice, a closed population of limited size accumulates F generation by generation, because the supply of unrelated partners eventually runs out. Conservation programs and breeders manage this by tracking F and by introducing new individuals when they can, which resets the shared-ancestry clock.
F in Practice
F is used wherever ancestry and homozygosity matter. Three fields lean on it heavily.
In human genetics and medical genetics, F helps assess the recessive-disease risk for the children of related couples, which is central to genetic counseling in communities where cousin marriage is common.
In animal breeding, F is tracked in studbooks for livestock, horses, and pedigree dogs. Breeders watch it because rising F predicts inbreeding depression and the surfacing of breed-specific genetic defects. Dog breeders, for example, often aim to keep the coefficient of inbreeding below about 5 percent.
In conservation biology, F flags endangered populations at risk from inbreeding depression, guiding decisions about breeding programs and the movement of animals between populations to restore diversity. These applications all rest on the same idea: F predicts homozygosity, and homozygosity predicts risk.
A Quick Worked Example
Take first cousins having a child. Why is the child's F exactly 0.0625? The logic is short.
First cousins share a set of grandparents. Trace an allele from one cousin up to a shared grandparent and back down to the other cousin. That path runs through several individuals, and at each one the allele passes with probability one-half. Count the links in the path and raise one-half to that power. For first cousins, the path through one shared grandparent has five links, giving one-half to the fifth power, which is 1/32. There are two shared grandparents, so two such paths, and 1/32 plus 1/32 is 1/16, or 0.0625.
That is the whole method in miniature: find the common ancestors, trace the paths, and add up one-half raised to the number of links in each. Closer relationships have shorter paths and so higher F. The full procedure, including pedigrees with multiple loops and already-inbred ancestors, is the subject of the calculation guide.
Common Questions
What does an inbreeding coefficient of 0 mean?
It means no detectable inbreeding. The individual's two alleles at a gene are treated as coming from unrelated ancestral lines, so the chance they are identical by descent is zero relative to the base population. Outbred individuals from unrelated parents have an F at or near 0.
Is a high inbreeding coefficient always harmful?
Not automatically, but the risk rises with F. A higher F means more homozygosity, which increases the chance of inheriting two copies of a harmful recessive allele and raises the likelihood of inbreeding depression. The danger is probabilistic, not guaranteed, but it grows steadily as F climbs, which is why breeders and geneticists track it.
How is the inbreeding coefficient different from the relationship coefficient?
The inbreeding coefficient F describes one individual: the chance its two alleles are identical by descent. The coefficient of relationship describes two individuals: the share of alleles they hold in common by descent. They are linked, since the F of a child equals half the relationship between its parents, but they answer different questions.
The Bottom Line
The inbreeding coefficient F is the probability that an individual's two alleles at a gene are identical by descent, on a scale from 0 to 1. It can be defined two equivalent ways: as that identity-by-descent probability from a pedigree, or as the proportional drop in heterozygosity from genetic data. Wright defined it in 1922, Malécot recast it as a probability in 1948, and it has been a core tool of genetics ever since.
What makes F useful is that one number predicts homozygosity, and homozygosity drives recessive-disease risk and inbreeding depression. The offspring of first cousins sit at 0.0625, full-sib or parent-child offspring at 0.25, and the scale halves with each step to a more distant relationship. To see exactly how those figures fall out of a family tree, our walkthrough on calculating the inbreeding coefficient traces the paths step by step.